Venn Diagram
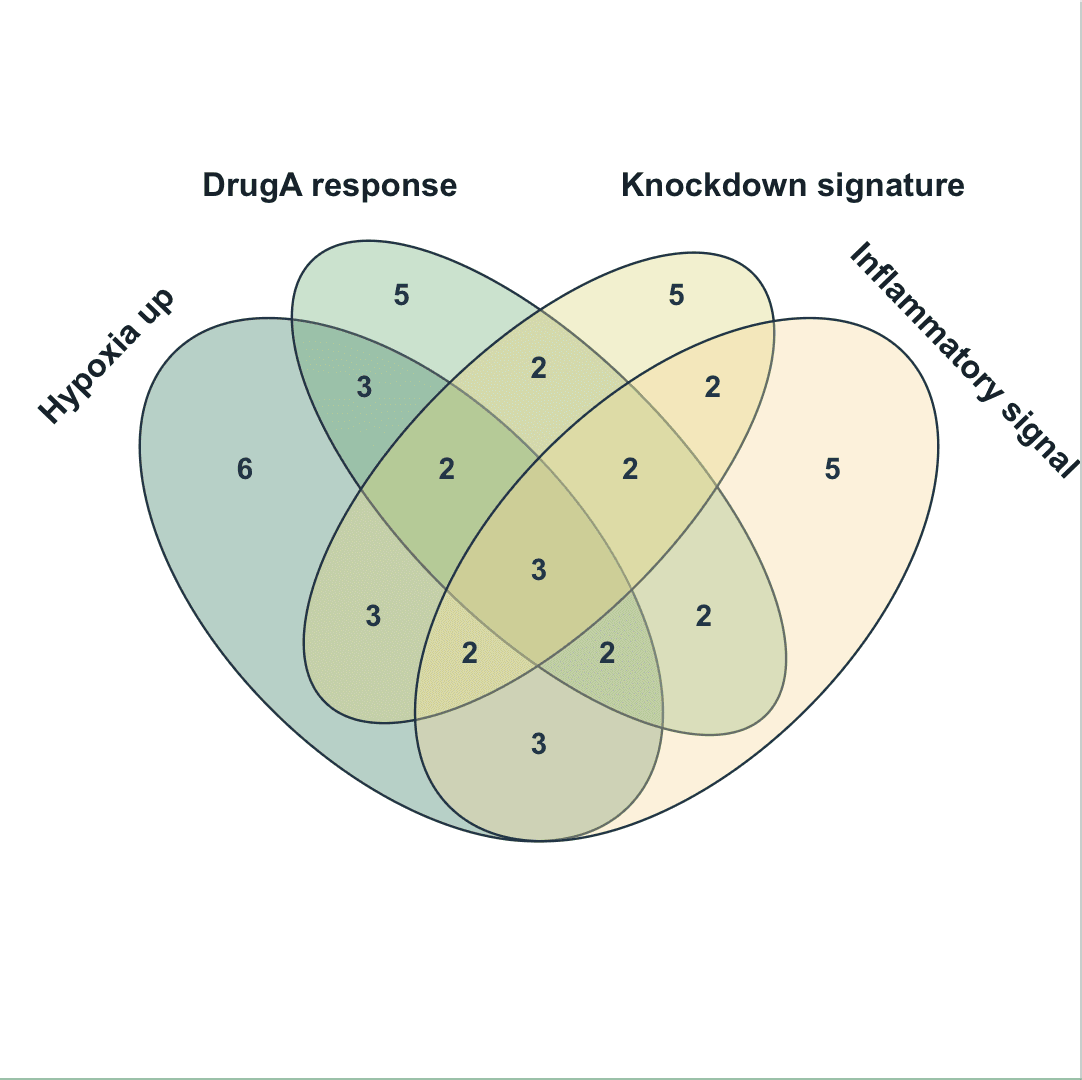 Venn diagram result
A Venn diagram shows which members are unique to each set and which members are shared between sets.
Prepare a directly mappable table
Venn diagrams are suitable for gene lists, sample IDs, compounds, pathways, or any text identifiers that need set-overlap comparison.
Use 2-4 columns. SmartPlot treats every non-empty unique value in each selected column as a member of that set.
Practice data · illustrates column structure| Set A | Set B | Set C |
|---|
| A01 | B01 | C01 |
| A02 | A02 | C02 |
| A03 | B03 | A03 |
| Shared | Shared | Shared |
Create a Venn diagram
Use Venn diagrams to compare overlap among 2-4 sets. Each selected column is treated as one set, and non-empty unique text values become set members.
Step 1Choose range and output
Confirm the data range, then choose a new figure or add the plot to an existing figure.
Venn Diagram setupInterface preview · non-interactive
×MenuPlot → Venn Diagram
Data rangeFull table: 4 rows, 3 columns
OutputNew figure
Add to existing figure
Venn Diagram setupInterface preview · non-interactive
×Map set members
Map Set A, Set B, Set C in order, making sure each selected column has the intended table role.
Step 3Set membership rules
Set Set labels, Duplicate members for the table structure and confirm that the choices match the intended reading.
Venn Diagram setupInterface preview · non-interactive
×Set labelsUse column titles⌄
Duplicate membersDeduplicate within sets⌄
Venn Diagram setupInterface preview · non-interactive
×✓Blank cells are ignored
✓Case rules are consistent
Data tableSet-membership practice data
Mapped columns3
Review and create
Check Blank cells are ignored, Case rules are consistent, review the mapped-column count, then choose Create figure.
Settings and pre-export checks
- Set columns
- Circle or ellipse layout
- Set fill and border
- Set labels
- Region counts and percentages
- Intersection tooltip
- Remove accidental spaces or inconsistent capitalization before plotting.
- Use Venn diagrams for 2-4 sets; for more sets, an UpSet-style view is usually easier to read.
- Counts come from exact member matching, so duplicate values inside one set are counted once.
- Area size is a layout aid unless an explicit proportional layout is selected.
- Export the intersection member table when the exact genes or samples are needed.