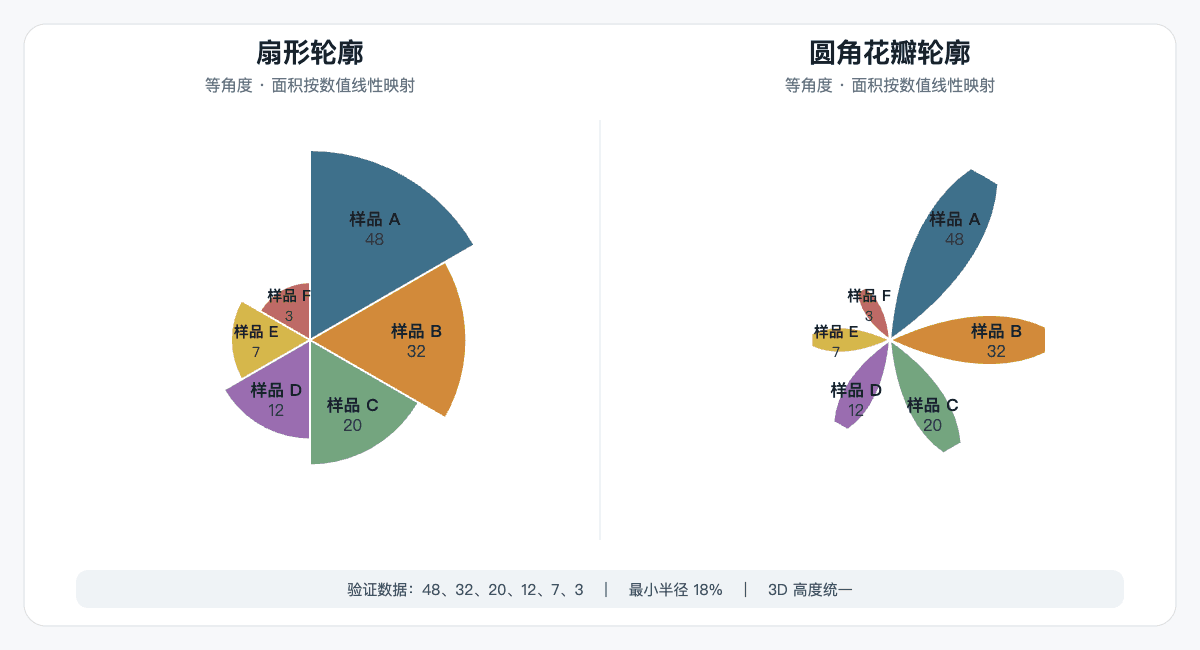
Variable-form pies use equal-angle wedges and encode values through radius and top shape. This is a Plus feature; standard 2D and 3D pies remain Free.
Prepare the data
Prepare one category column and one non-negative numeric column. Use a small number of categories and retain value labels for precise reading.
This practice dataset is not the source of the screenshot. Keep category and value in separate columns; check missing values, negative values, and duplicate categories.
Practice data · not the screenshot source
Category
Value
Sample A
40
Sample B
28
Sample C
18
Sample D
12
Sample E
8
Sample F
4
Create a variable-form pie
Create from the pie menu, then review the encoding in Layout.
Step 1
Creation entry
Open Pie Chart → Variable-form Pie and choose the data range.
Variable-form Pie SetupInterface preview · non-interactive
×
MenuPie Chart → Variable-form Pie
Data range
Full table: 6 rows, 2 columns
Output
New figure
Add to existing figure
Step 2
Column mapping
Map category and non-negative value columns, then create the figure.
Variable-form Pie SetupInterface preview · non-interactive
×
Category column
Category · Group⌄
Value column
Value · Y⌄
Step 3
Variable-form Encoding
Open Pie Chart → Layout → Variable-form Encoding to choose top shape and radius mapping.
Variable-form Pie SetupInterface preview · non-interactive
×
Top shape
SectorRounded petal
Radius
UniformEncode value
Value mapping
Linear area (recommended)⌄
Minimum radius
35%⌄
Step 4
Before export
Refine labels, leader lines, and colors; check that the visual encoding does not overstate differences.
Variable-form Pie SetupInterface preview · non-interactive
×
✓Show category and value labels
✓Show leader lines
✓All values are non-negative
Data tableComposition practice data
Mapped columns2
Two top shapes in the same chart family: sector and rounded petal
Interpretation and pre-export checks
Equal-angle wedges do not encode proportions through angle. Percentage labels still come from the numeric total.
With uniform radius, wedges have equal visible area; values are conveyed by labels only.
Linear area mapping uses a square-root radius transform. Minimum radius affects the visual baseline; do not read visible petal area directly as a percentage.
Linear radius mapping emphasizes differences. Value-driven 3D depth amplifies them further; use uniform depth or a bar chart for precise comparison.