WHAT’S NEW?
SmartPlot V1.95: map the process, then show the evidence
SmartPlot 1.95 introduces a dedicated, editable flowchart workspace and adds four scientific chart workflows: Auto Stack, raincloud plots, paired scatter plots, and rose charts.
Build editable flowcharts inside SmartPlot
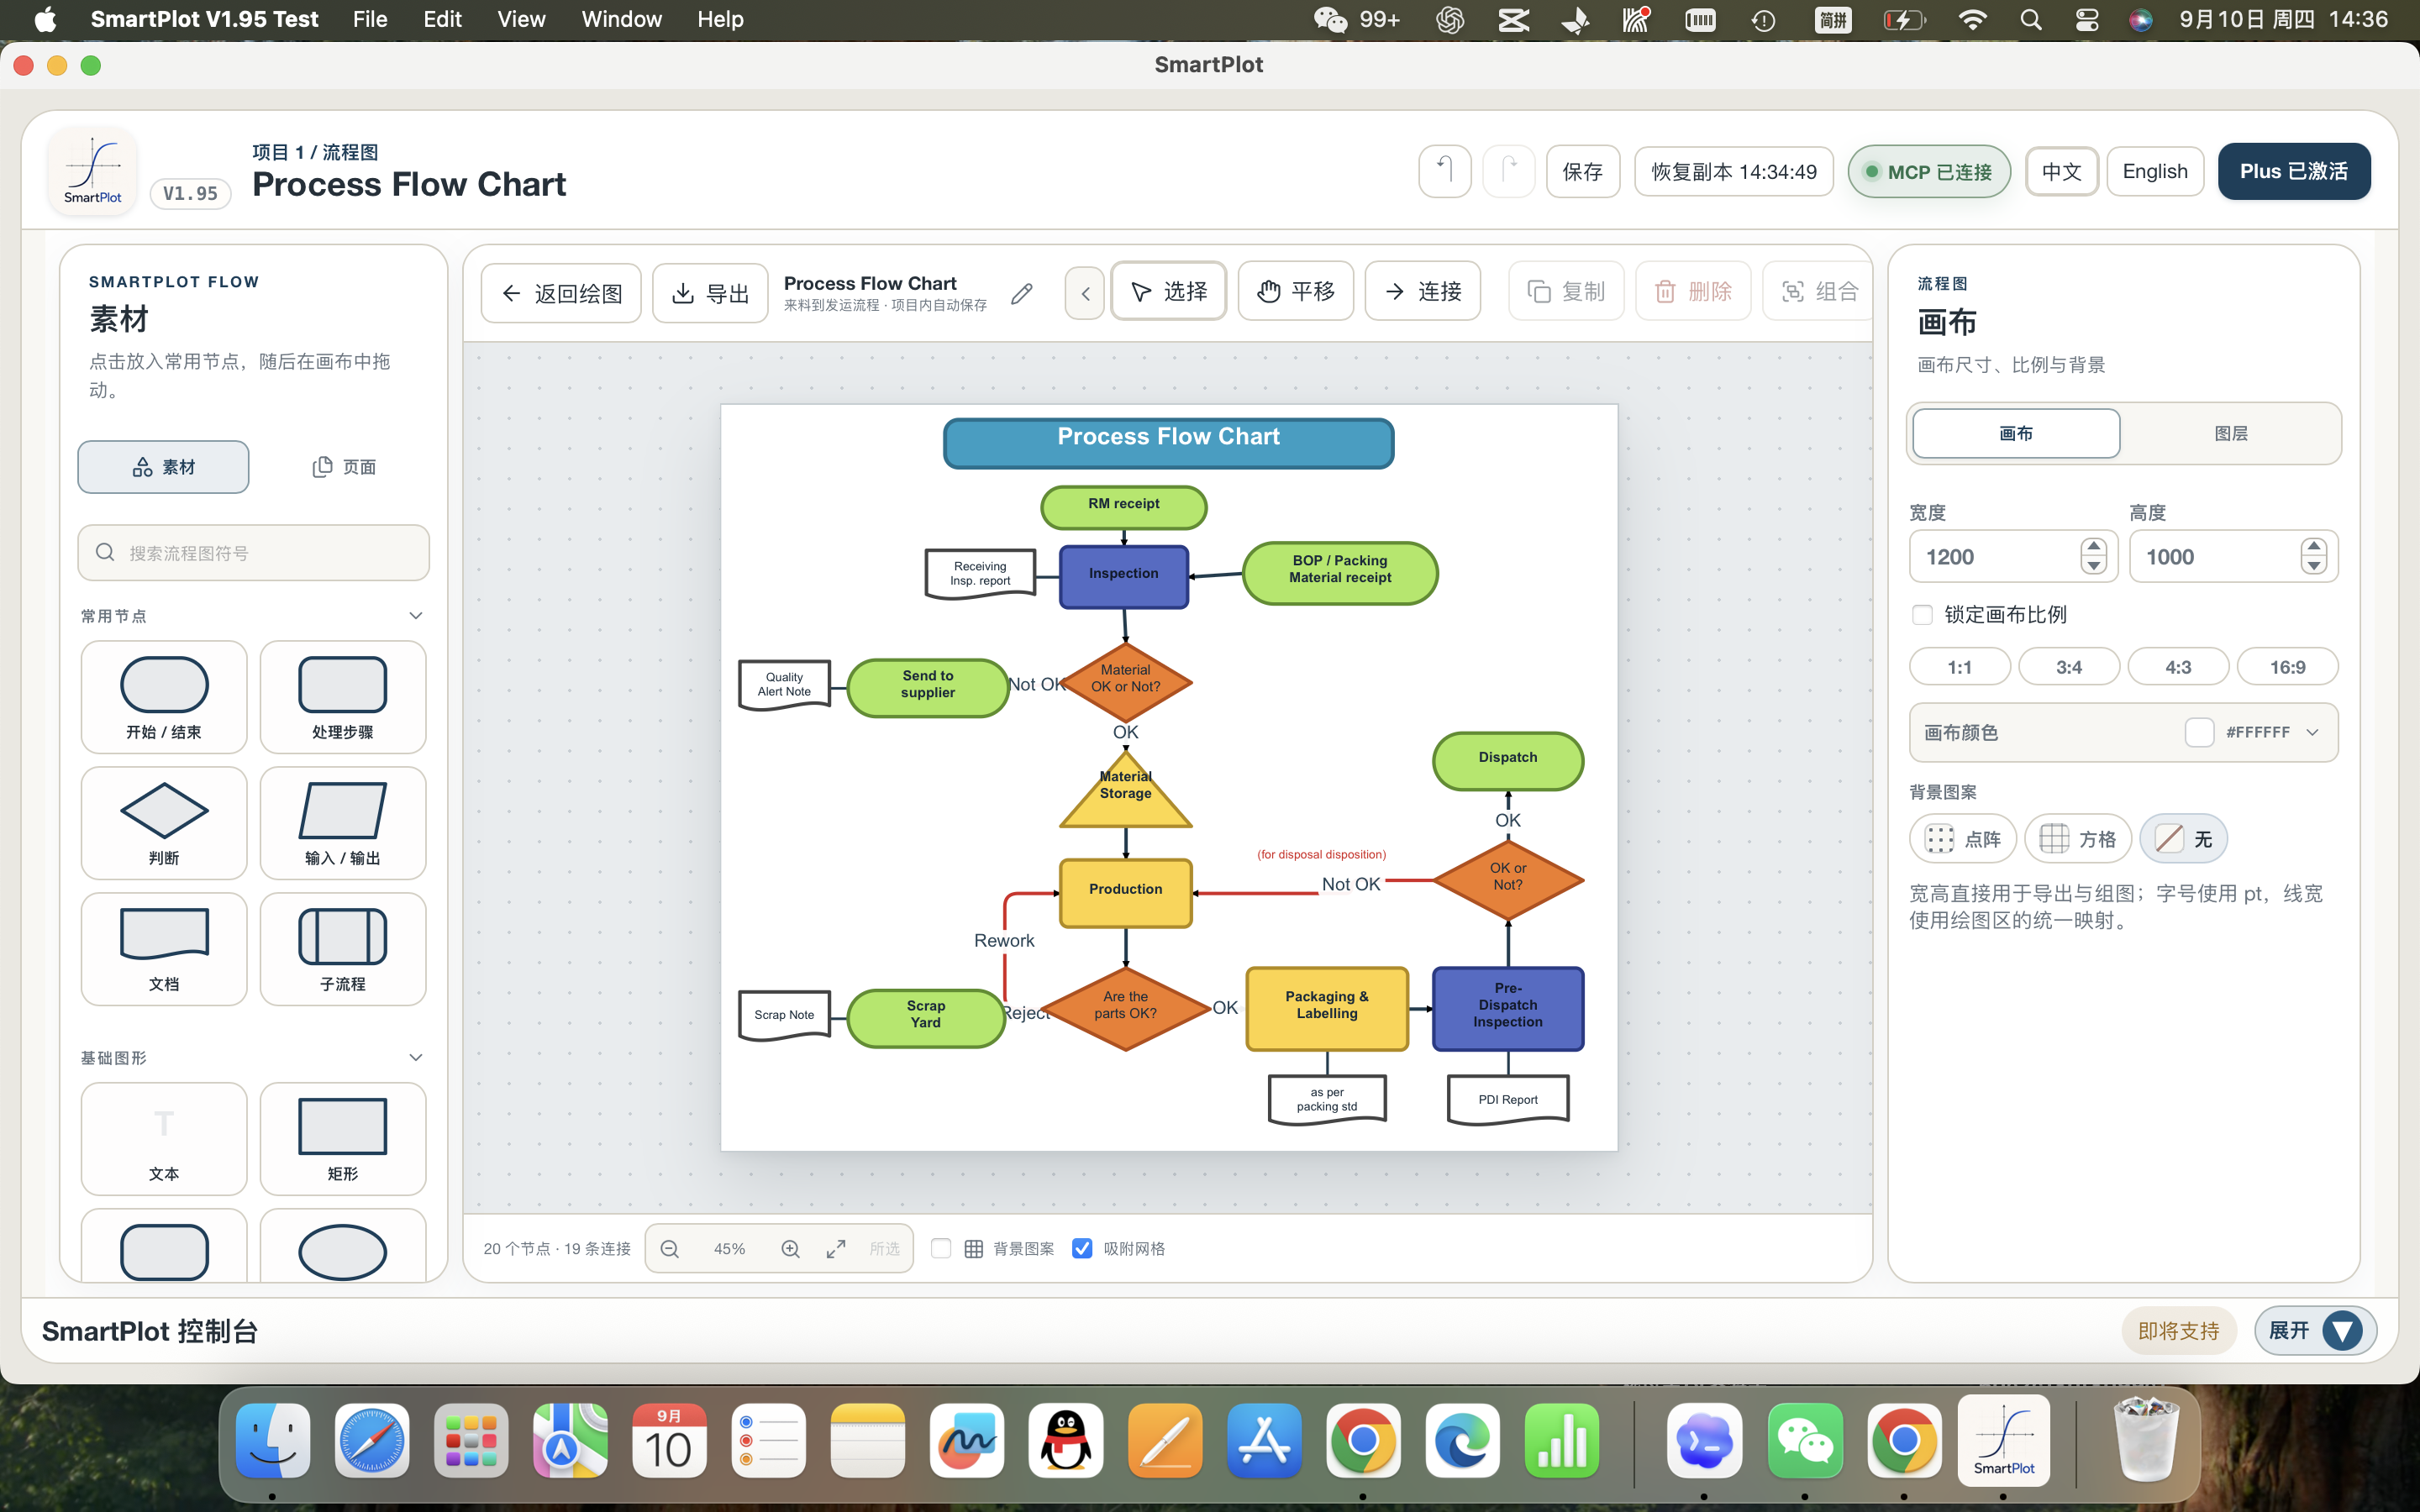
V1.95 adds a dedicated flowchart workspace with a symbol library, focused canvas, page structure, and inspectors for the diagram, nodes, and connectors.
- Start with standard process, decision, input/output, document, subprocess, and basic shape nodes.
- Drag, resize, align, group, lock, and restyle nodes while keeping every label editable.
- Use a canvas sized in the same saved units as SmartPlot figures, ready for composition and export.
Keep the structure semantic—from connector to export
Straight, orthogonal, and curved connectors preserve their endpoints and direction while nodes and labels remain independent objects. MCP-created diagrams use the same editable model as diagrams built by hand.
- Choose anchors, line styles, arrowheads, labels, route points, and connector colors.
- Organize multi-page diagrams and move between overview editing and precise inspector controls.
- Export through SmartPlot’s single-figure path or place the flowchart in Figure Composer.
See within-subject change with paired scatter plots
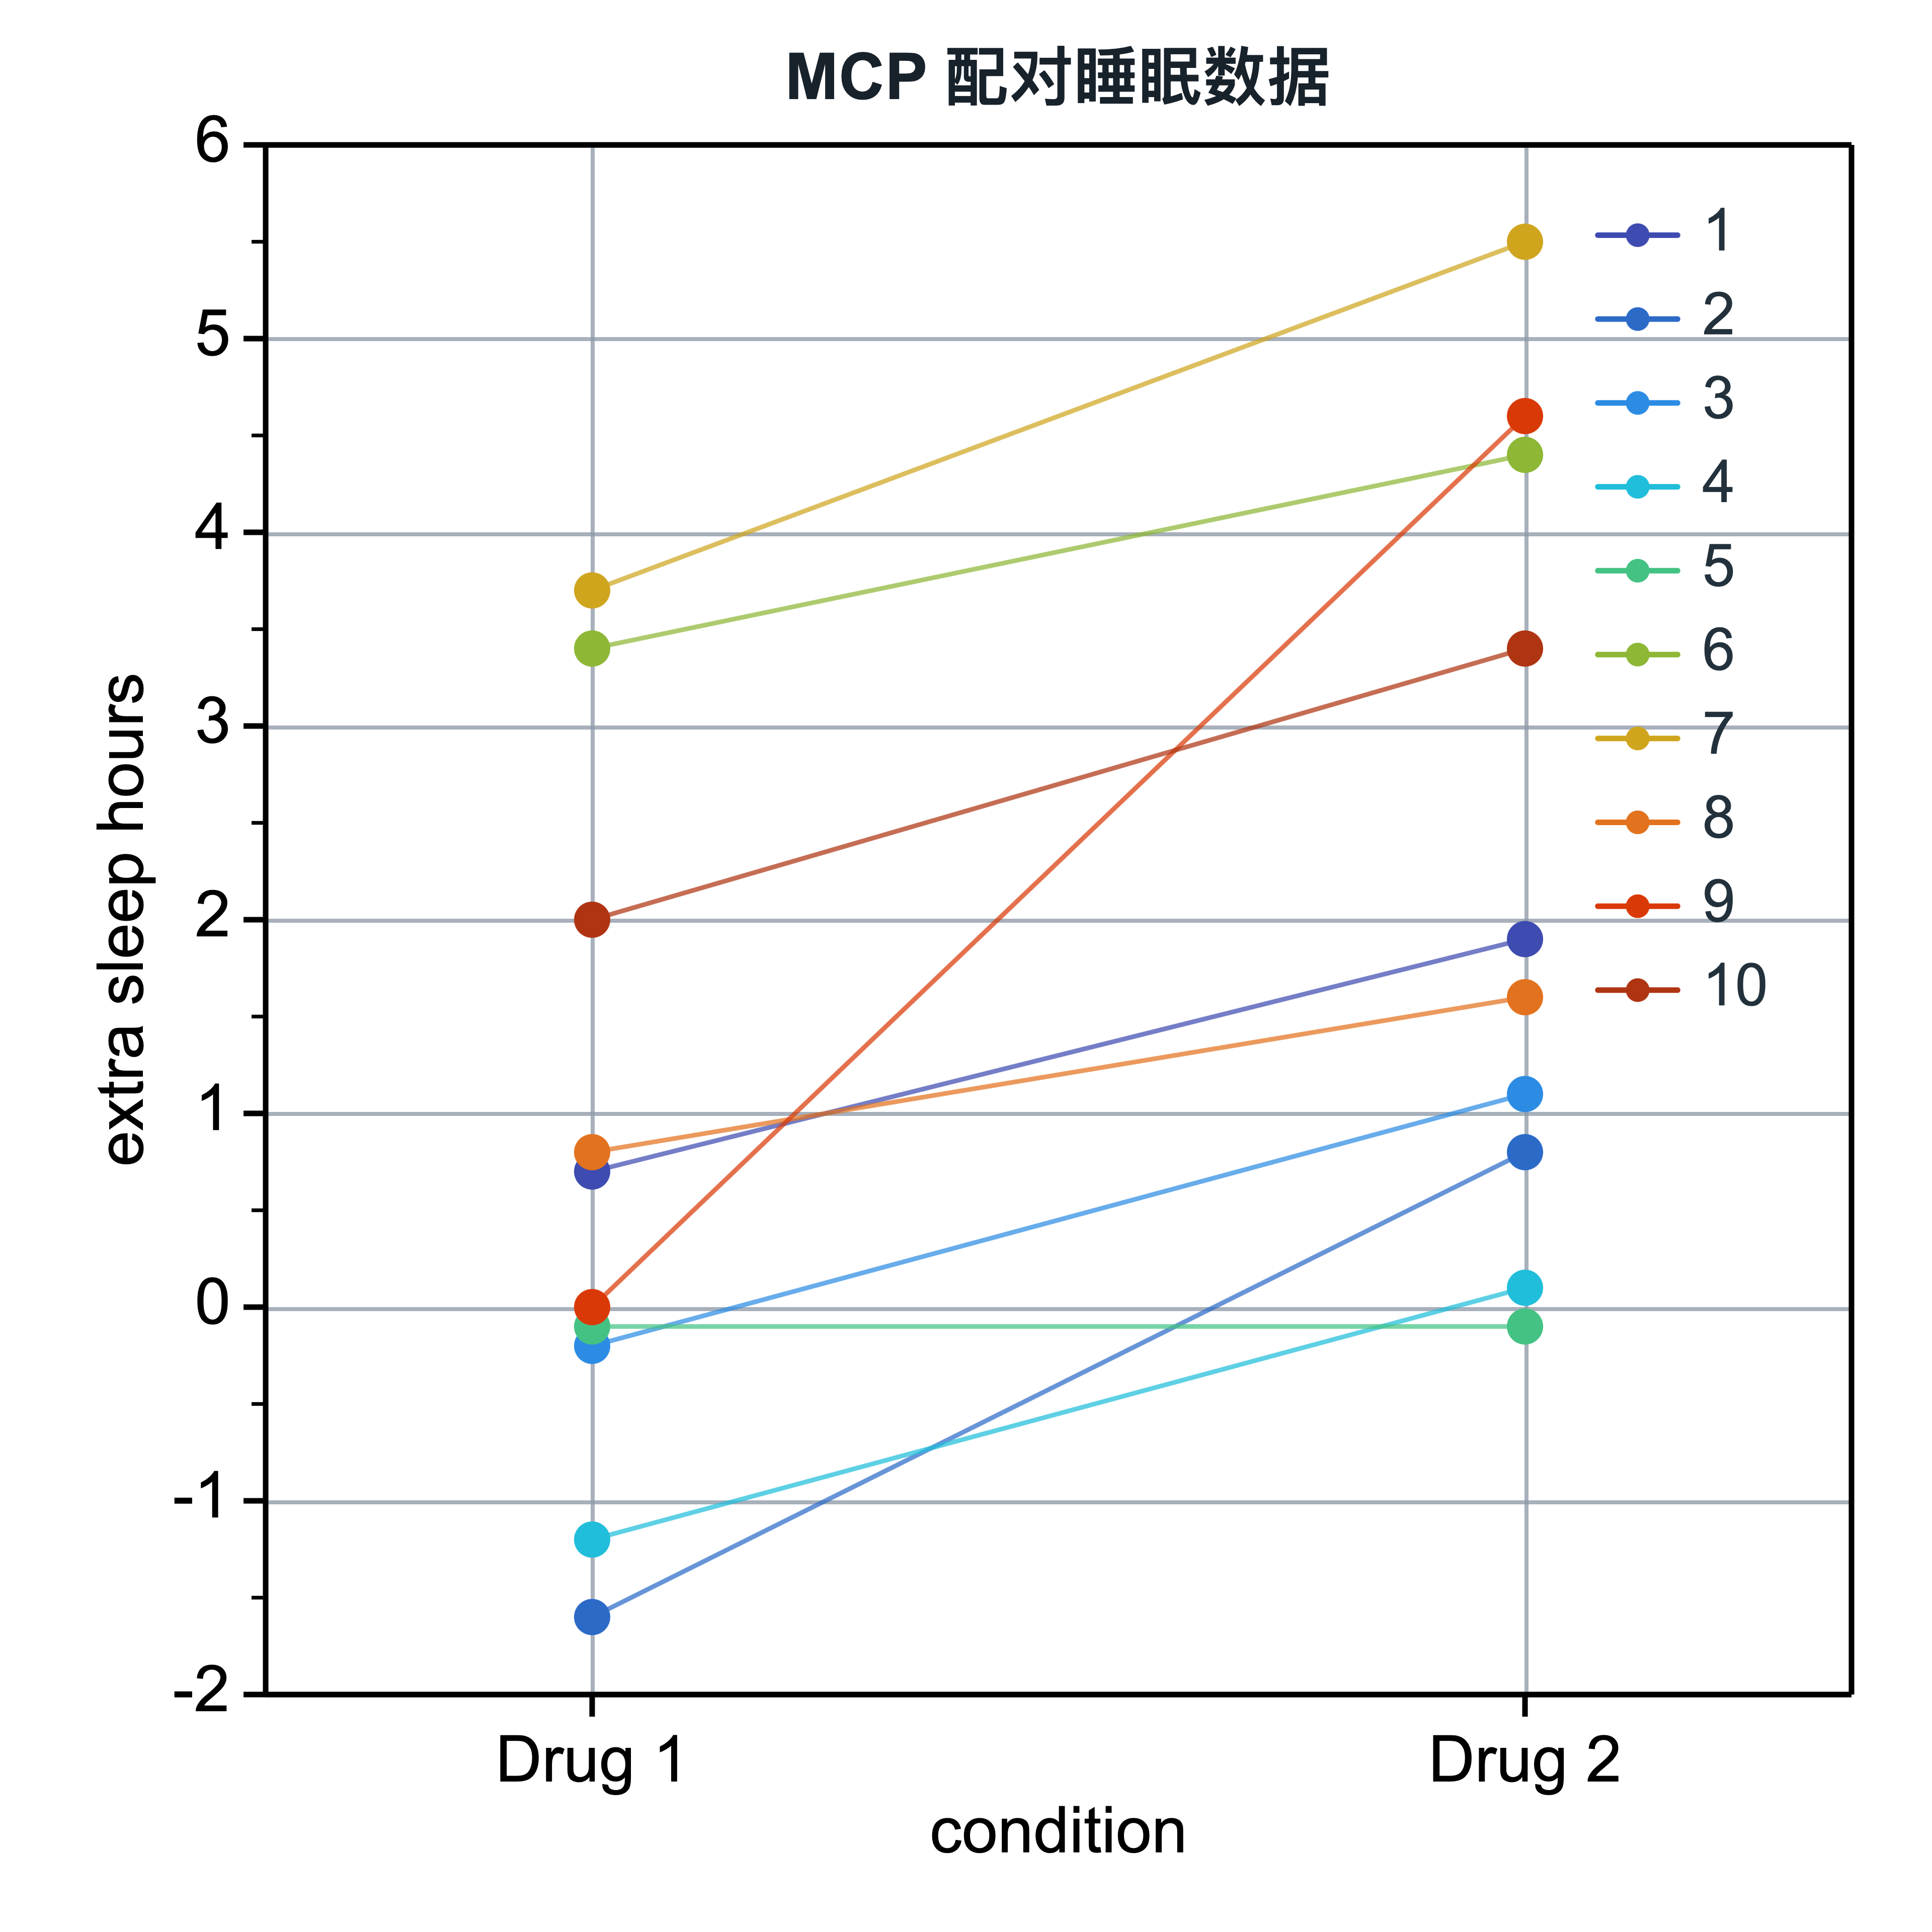
Map subject, condition, and value columns from a long table, then keep repeated observations connected so individual direction and group-level patterns remain visible together.
- Order conditions explicitly and preserve each subject’s pairing across them.
- Style markers by condition or subject, with neutral, colored, or arrowed connectors.
- Use subject legends only when subject color is part of the intended reading.
Compare shape, summary, and observations in a raincloud plot
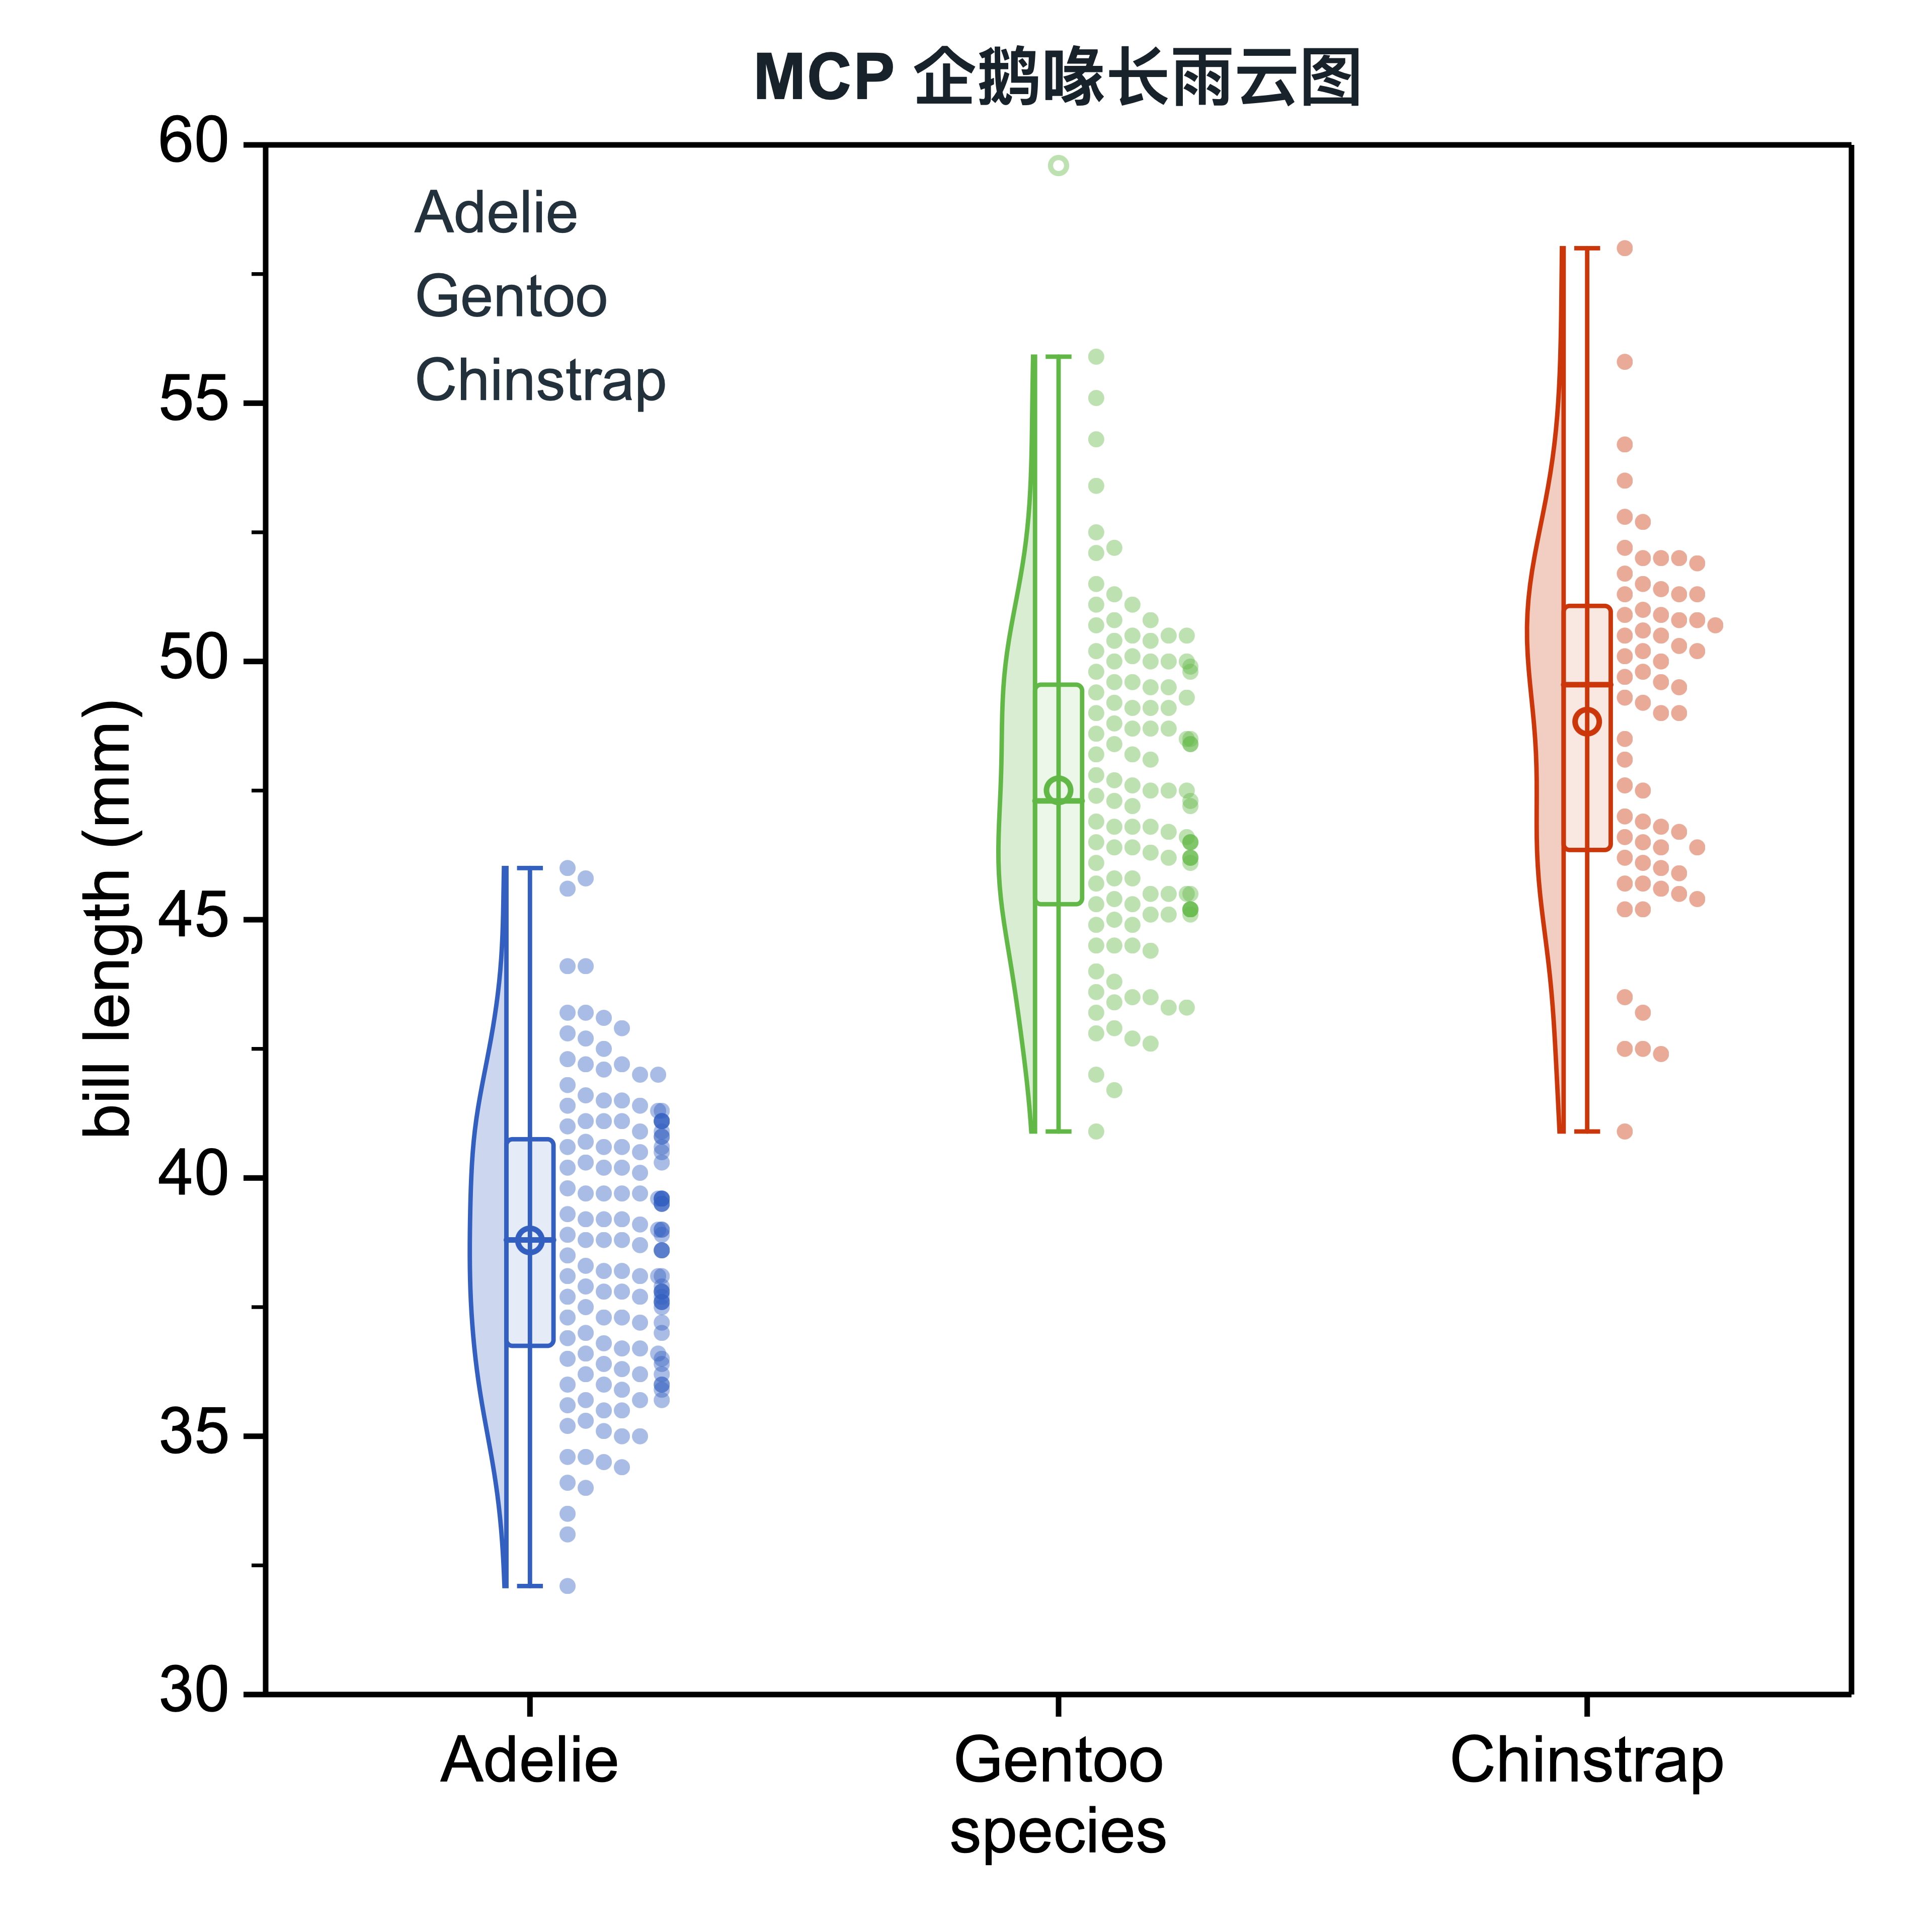
Raincloud plots place a one-sided density, box summary, and raw observations on one value axis, so distribution shape is not hidden behind a single statistic.
- Switch density side, width, opacity, smoothing, and observed-range truncation.
- Use deterministic beeswarm or jittered points and choose which side holds the observations.
- Show or hide the box, mean, median, outliers, density line, and density fill independently.
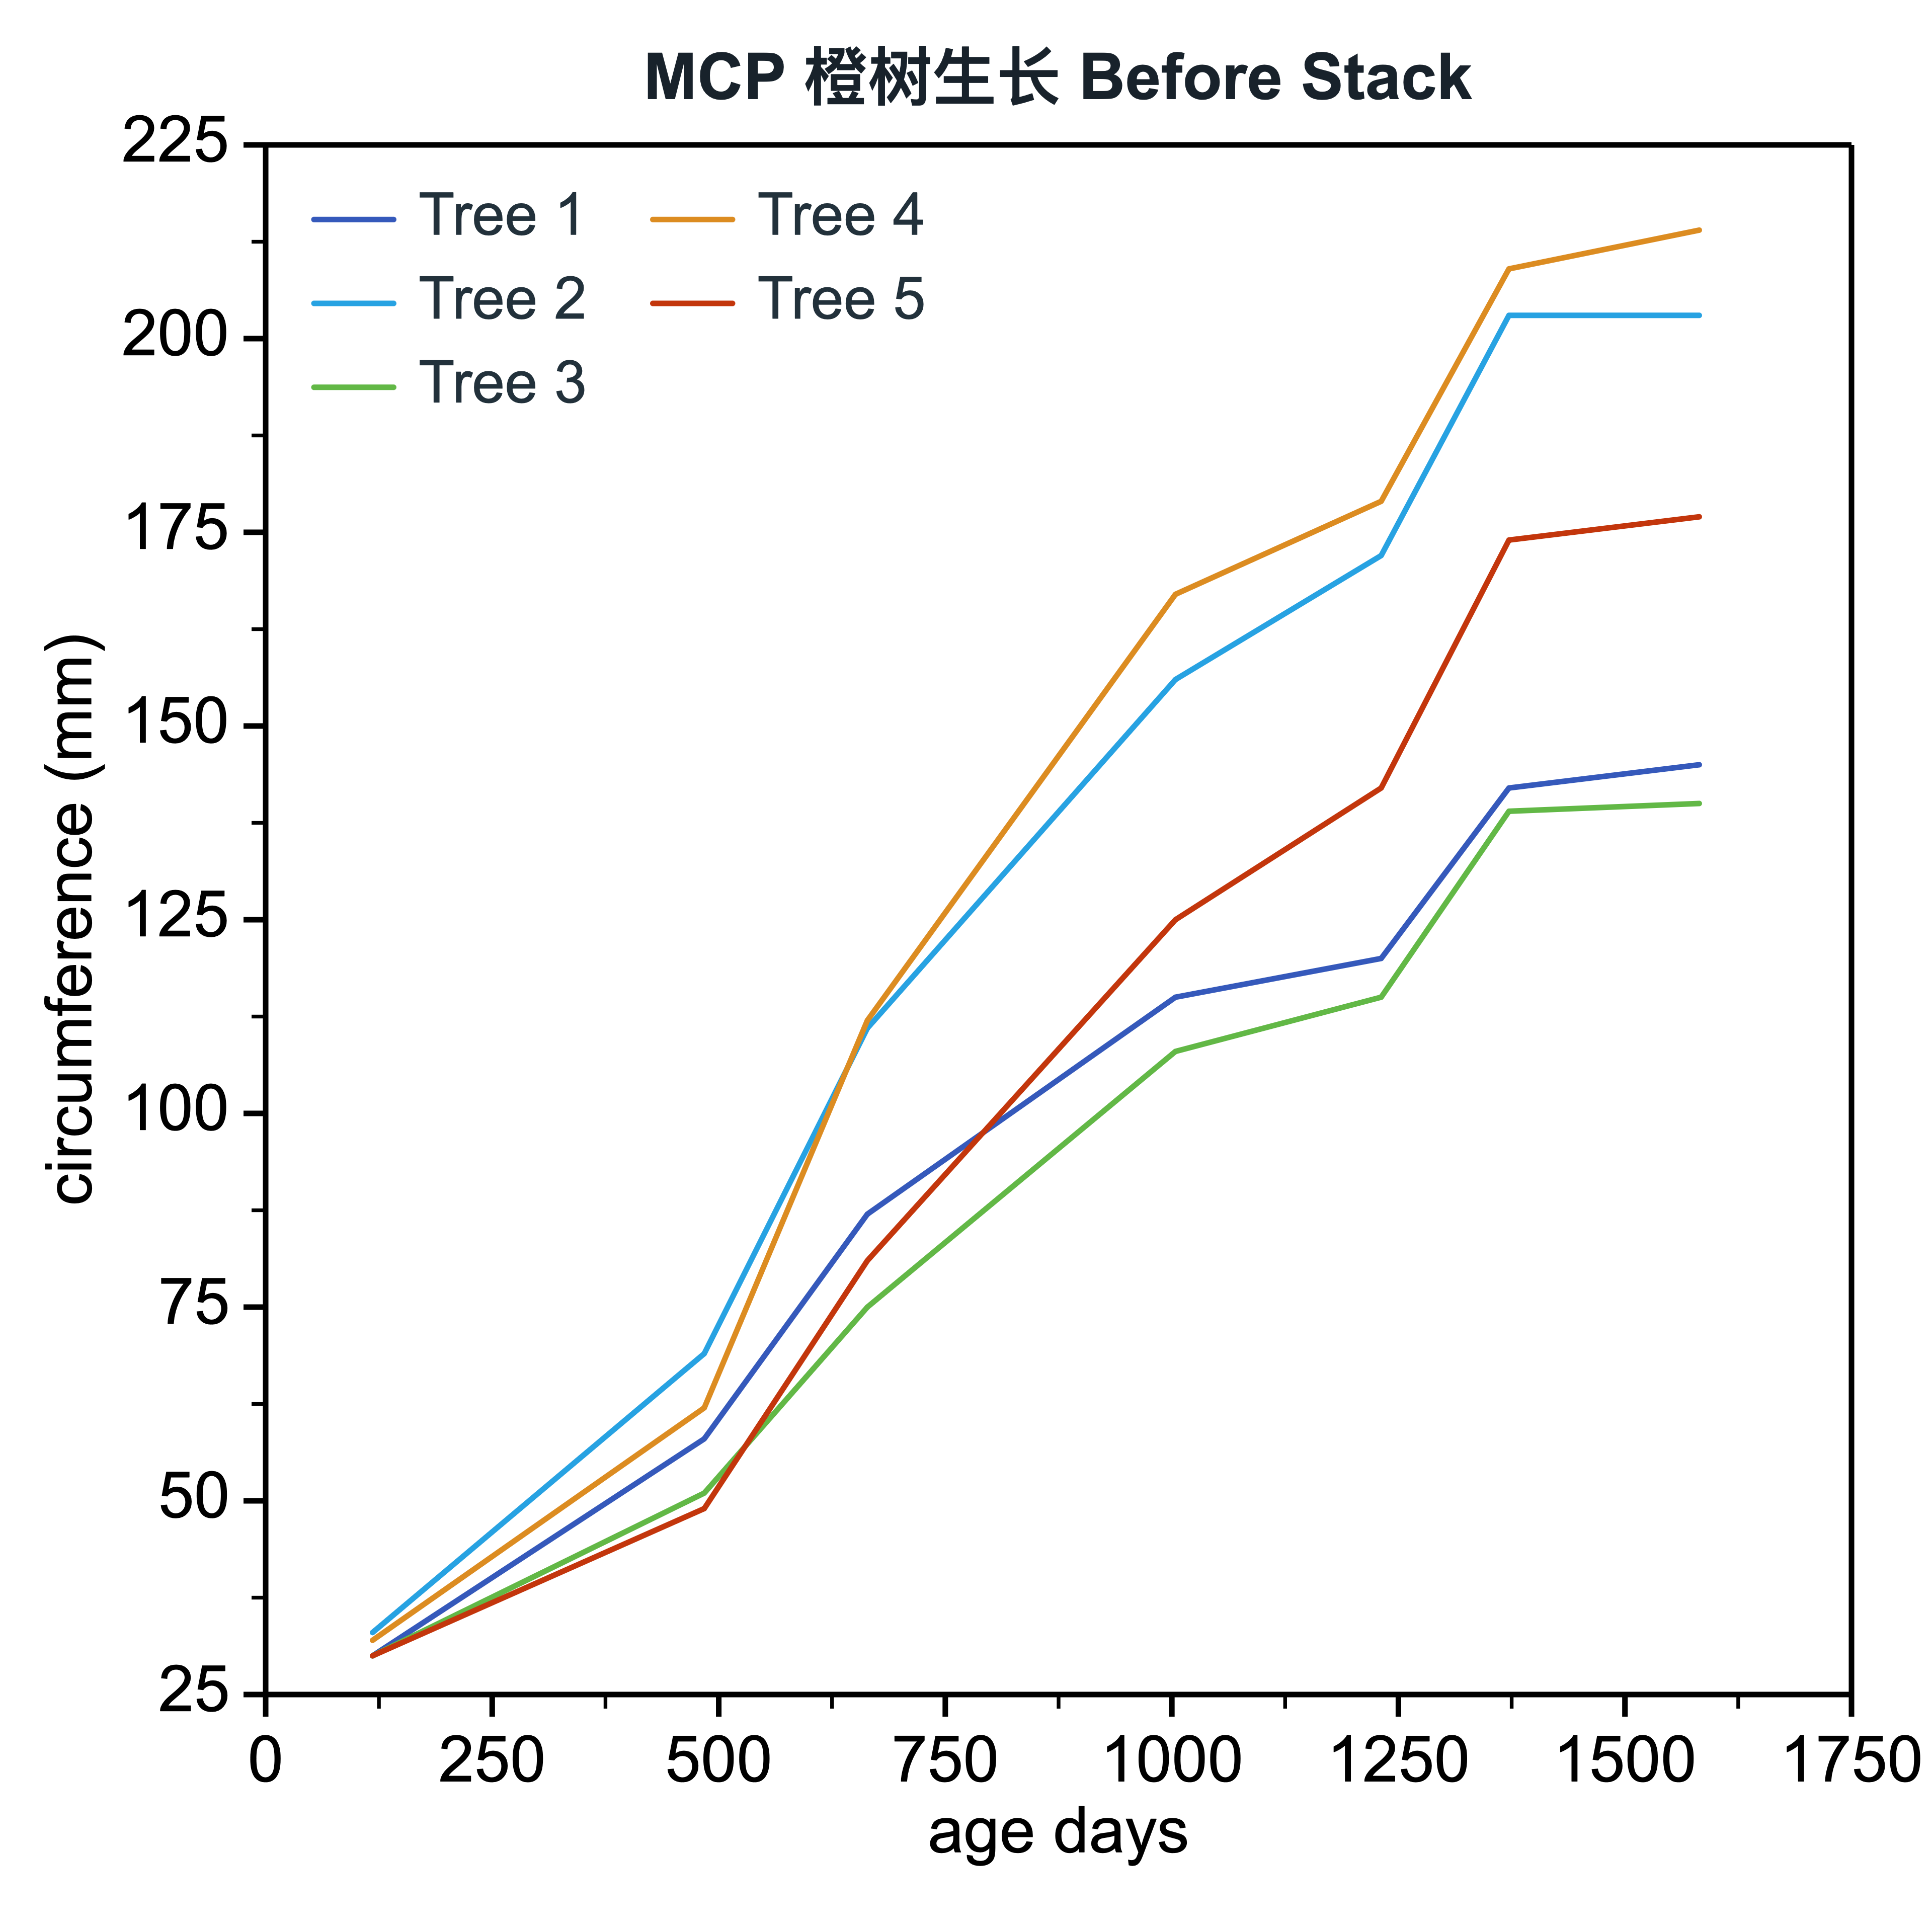
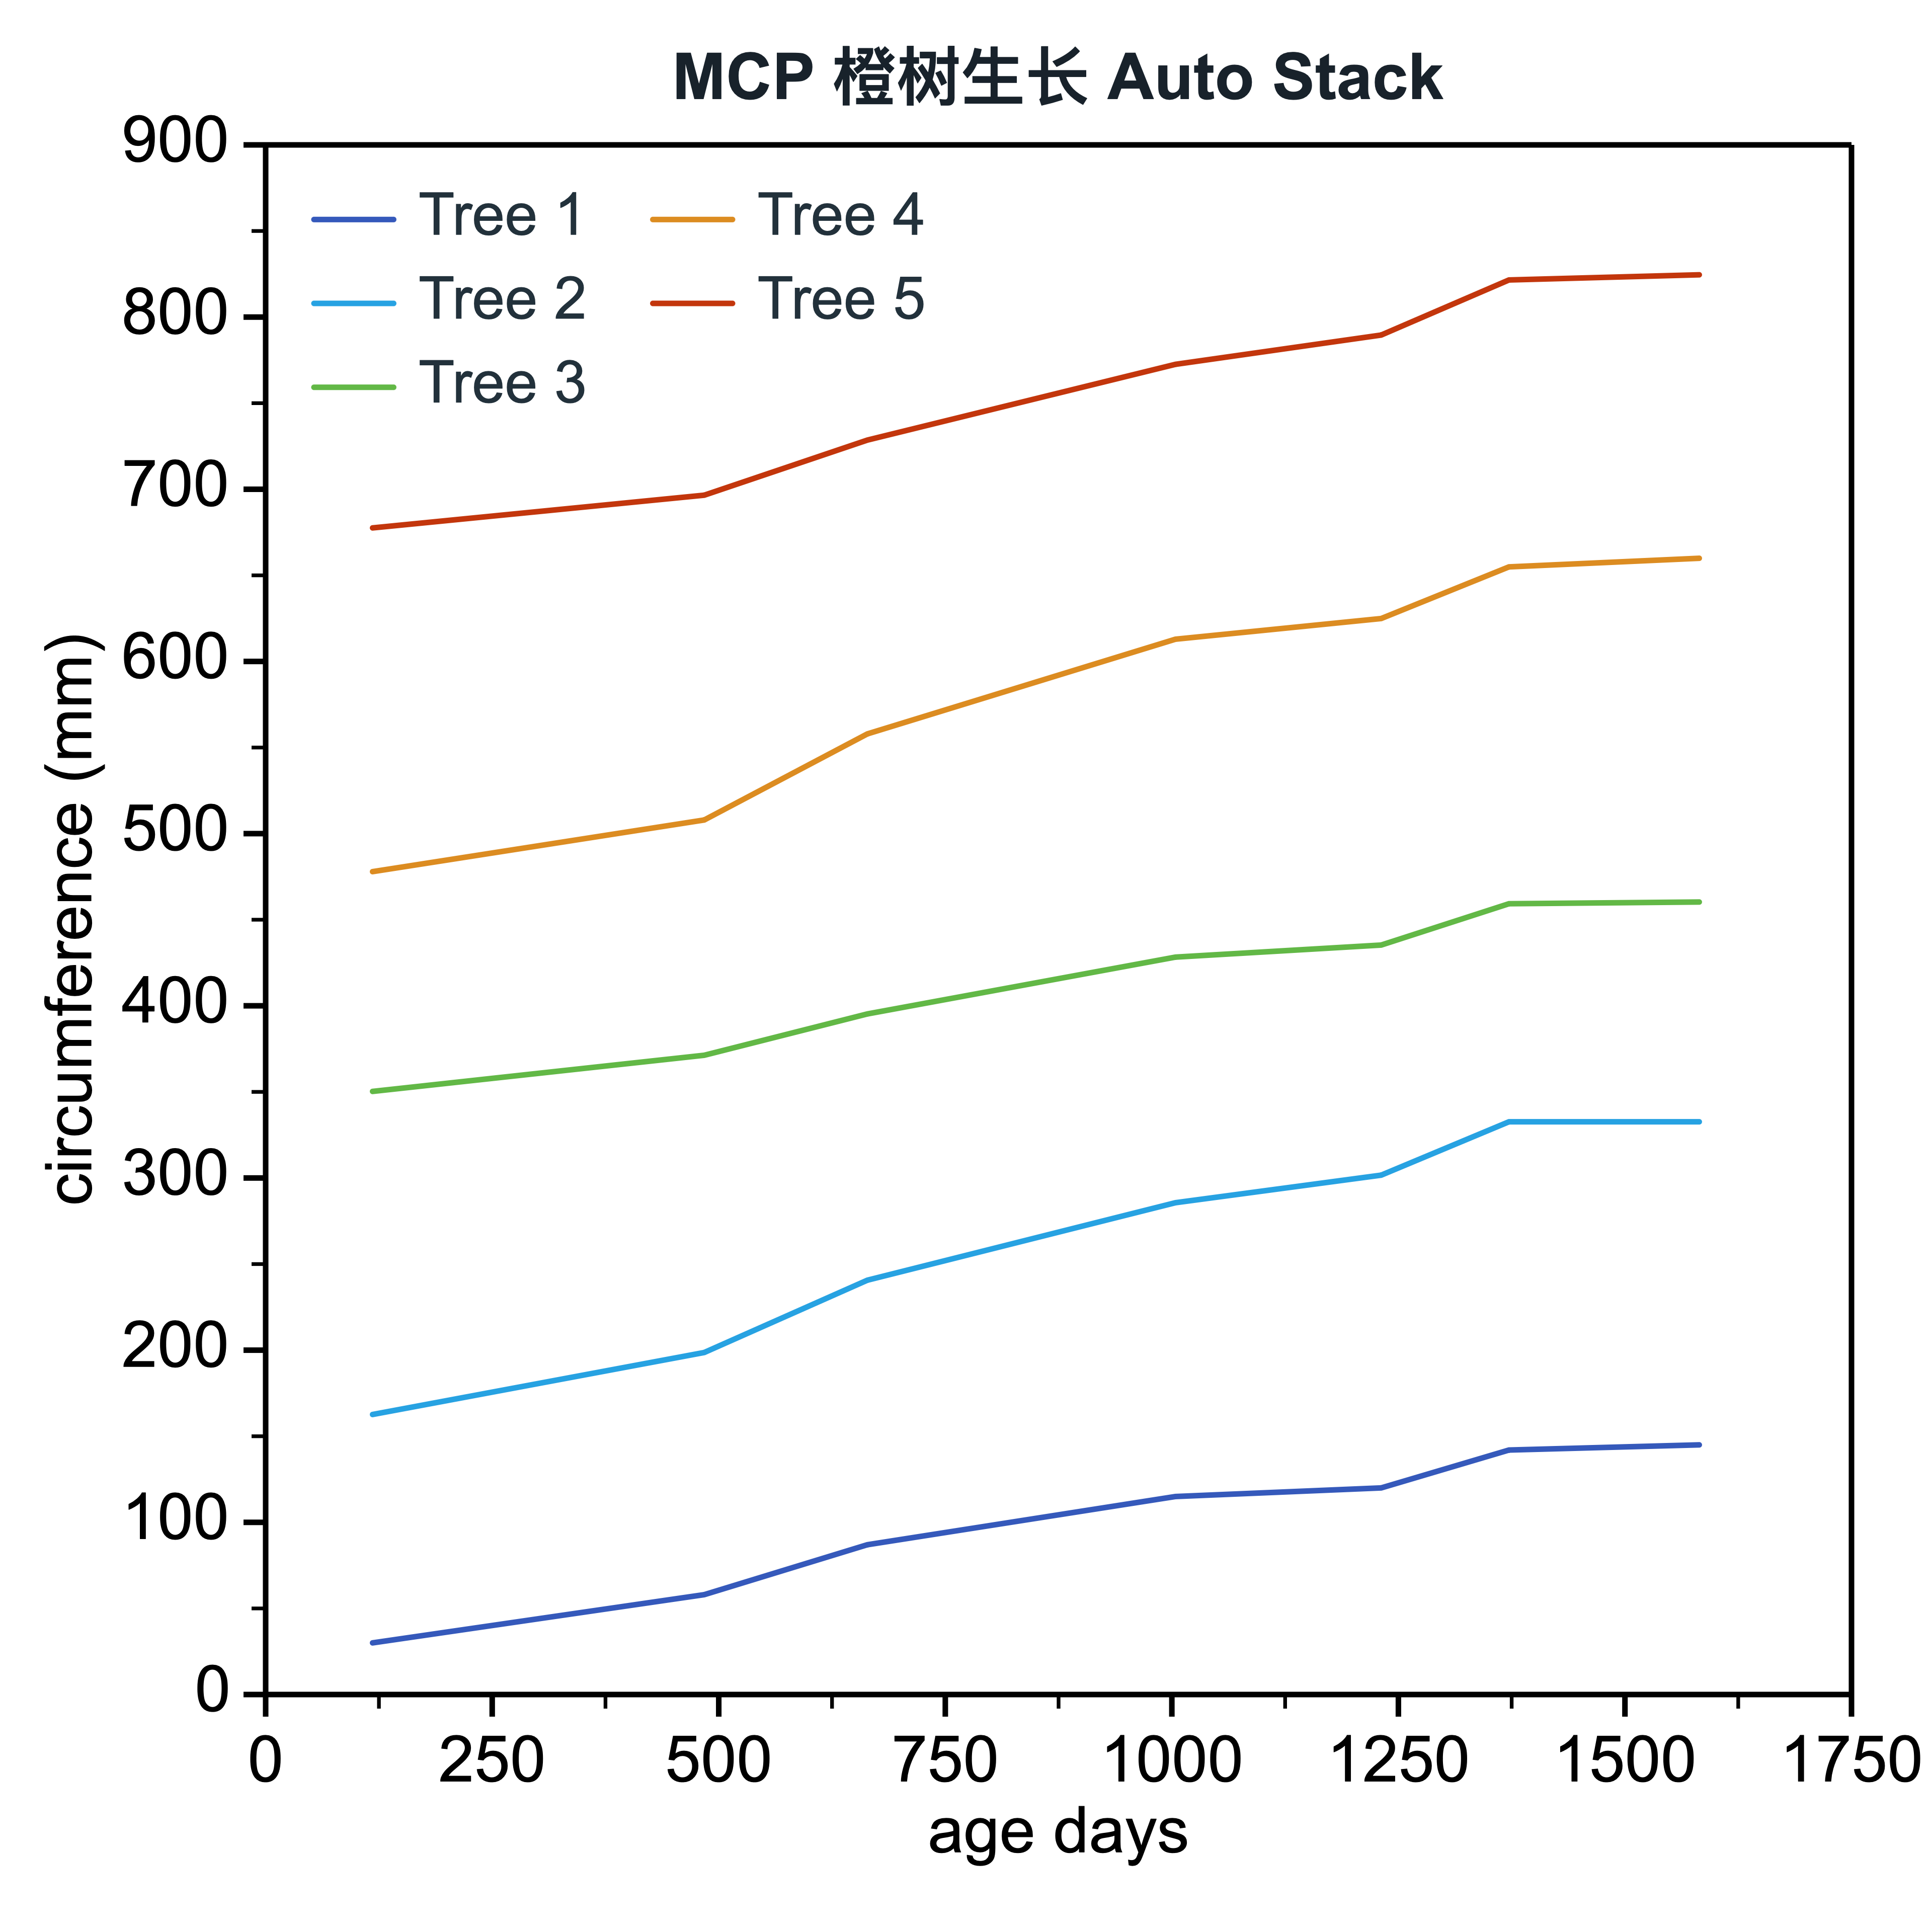
Separate dense curves with display-only Auto Stack
Auto Stack calculates X or Y display offsets from the visible ranges of multiple data lines. It separates overlapping traces without rewriting the source table.
- Apply automatic spacing from the plot entry point or an existing data-line inspector.
- Keep the original values intact while saving only reversible display offsets.
- Review the offset summary, mark the axis as display-shifted, or restore every series to its original position.
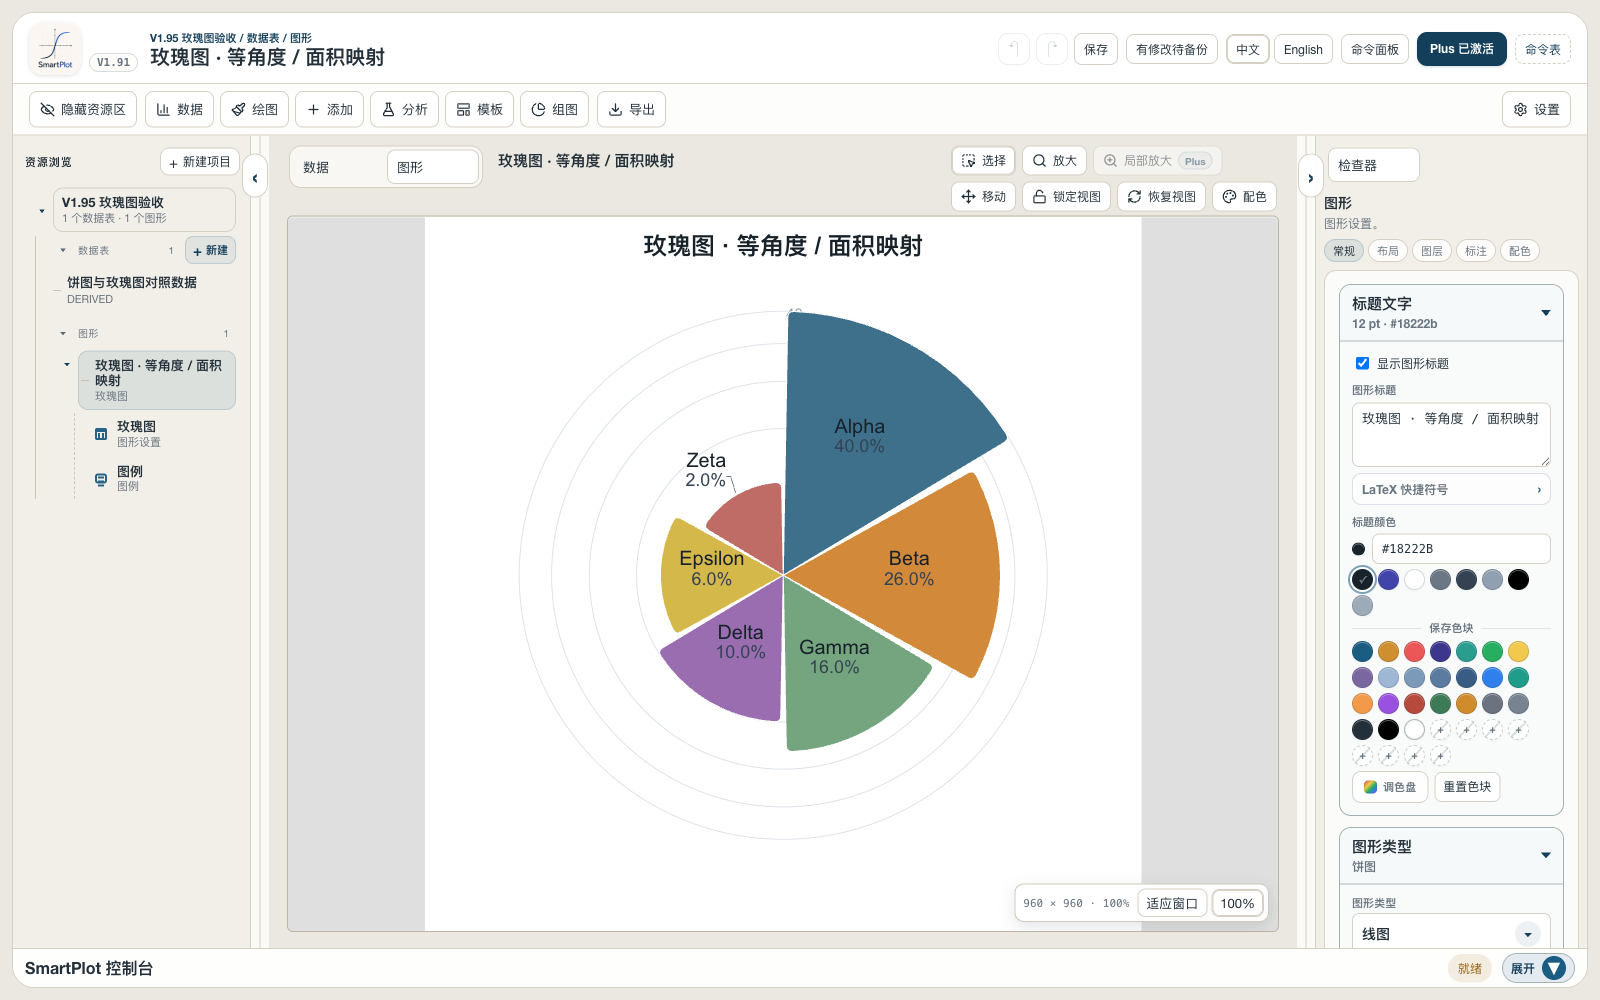
Compare radial magnitude with rose charts
Rose charts use equal-angle sectors while mapping magnitude to radius or area, keeping the radial scale explicit instead of implying that angle represents value.
- Choose area or radius mapping and use sector, rounded-sector, or petal contours.
- Add radial guides, tick labels, gaps, labels, and palette styling for clearer comparisons.
- Create standard 2D rose charts in Free; 3D rose rendering is available in Plus.
Also included in V1.95
Flowchart nodes and connectors share SmartPlot’s saved sizing semantics and can be exported through the standard single-figure formats.
MCP can create a semantic flowchart from a user-approved structure and return node, connector, and layout readback for iterative refinement.
Paired scatter and raincloud controls are available inside Figure Composer instead of falling back to an empty generic inspector.
Auto Stack records reversible X/Y display offsets and never changes the source measurements.
Rose charts support equal-angle radial comparison with area or radius mapping; 3D rose rendering is a Plus feature.
Project save, recovery, and import paths received additional validation and clearer failure handling ahead of release.
Past News
SmartPlot V1.9
August 31, 2026A rebuilt Figure Composer, advanced pie charts, mixed correlation matrices, and stronger reusable workflows.
Issue 1.85SmartPlot V1.85
August 17, 2026Pie, donut, and lollipop plots, analysis workflow templates, function reference lines, and editing refinements.
Issue 1.75SmartPlot V1.75
July 22, 2026Radar charts, grouped layers, denser data tools, analysis updates, and a broader Smart Panel.