Choose a plot from the research question.
This is more than a plot list. Define the question, check the table structure, then open the real creation tutorial.
Trends & relationships
Continuous change, paired measurements, multivariable association, and repeated observations.
1 X + 1–many Y columns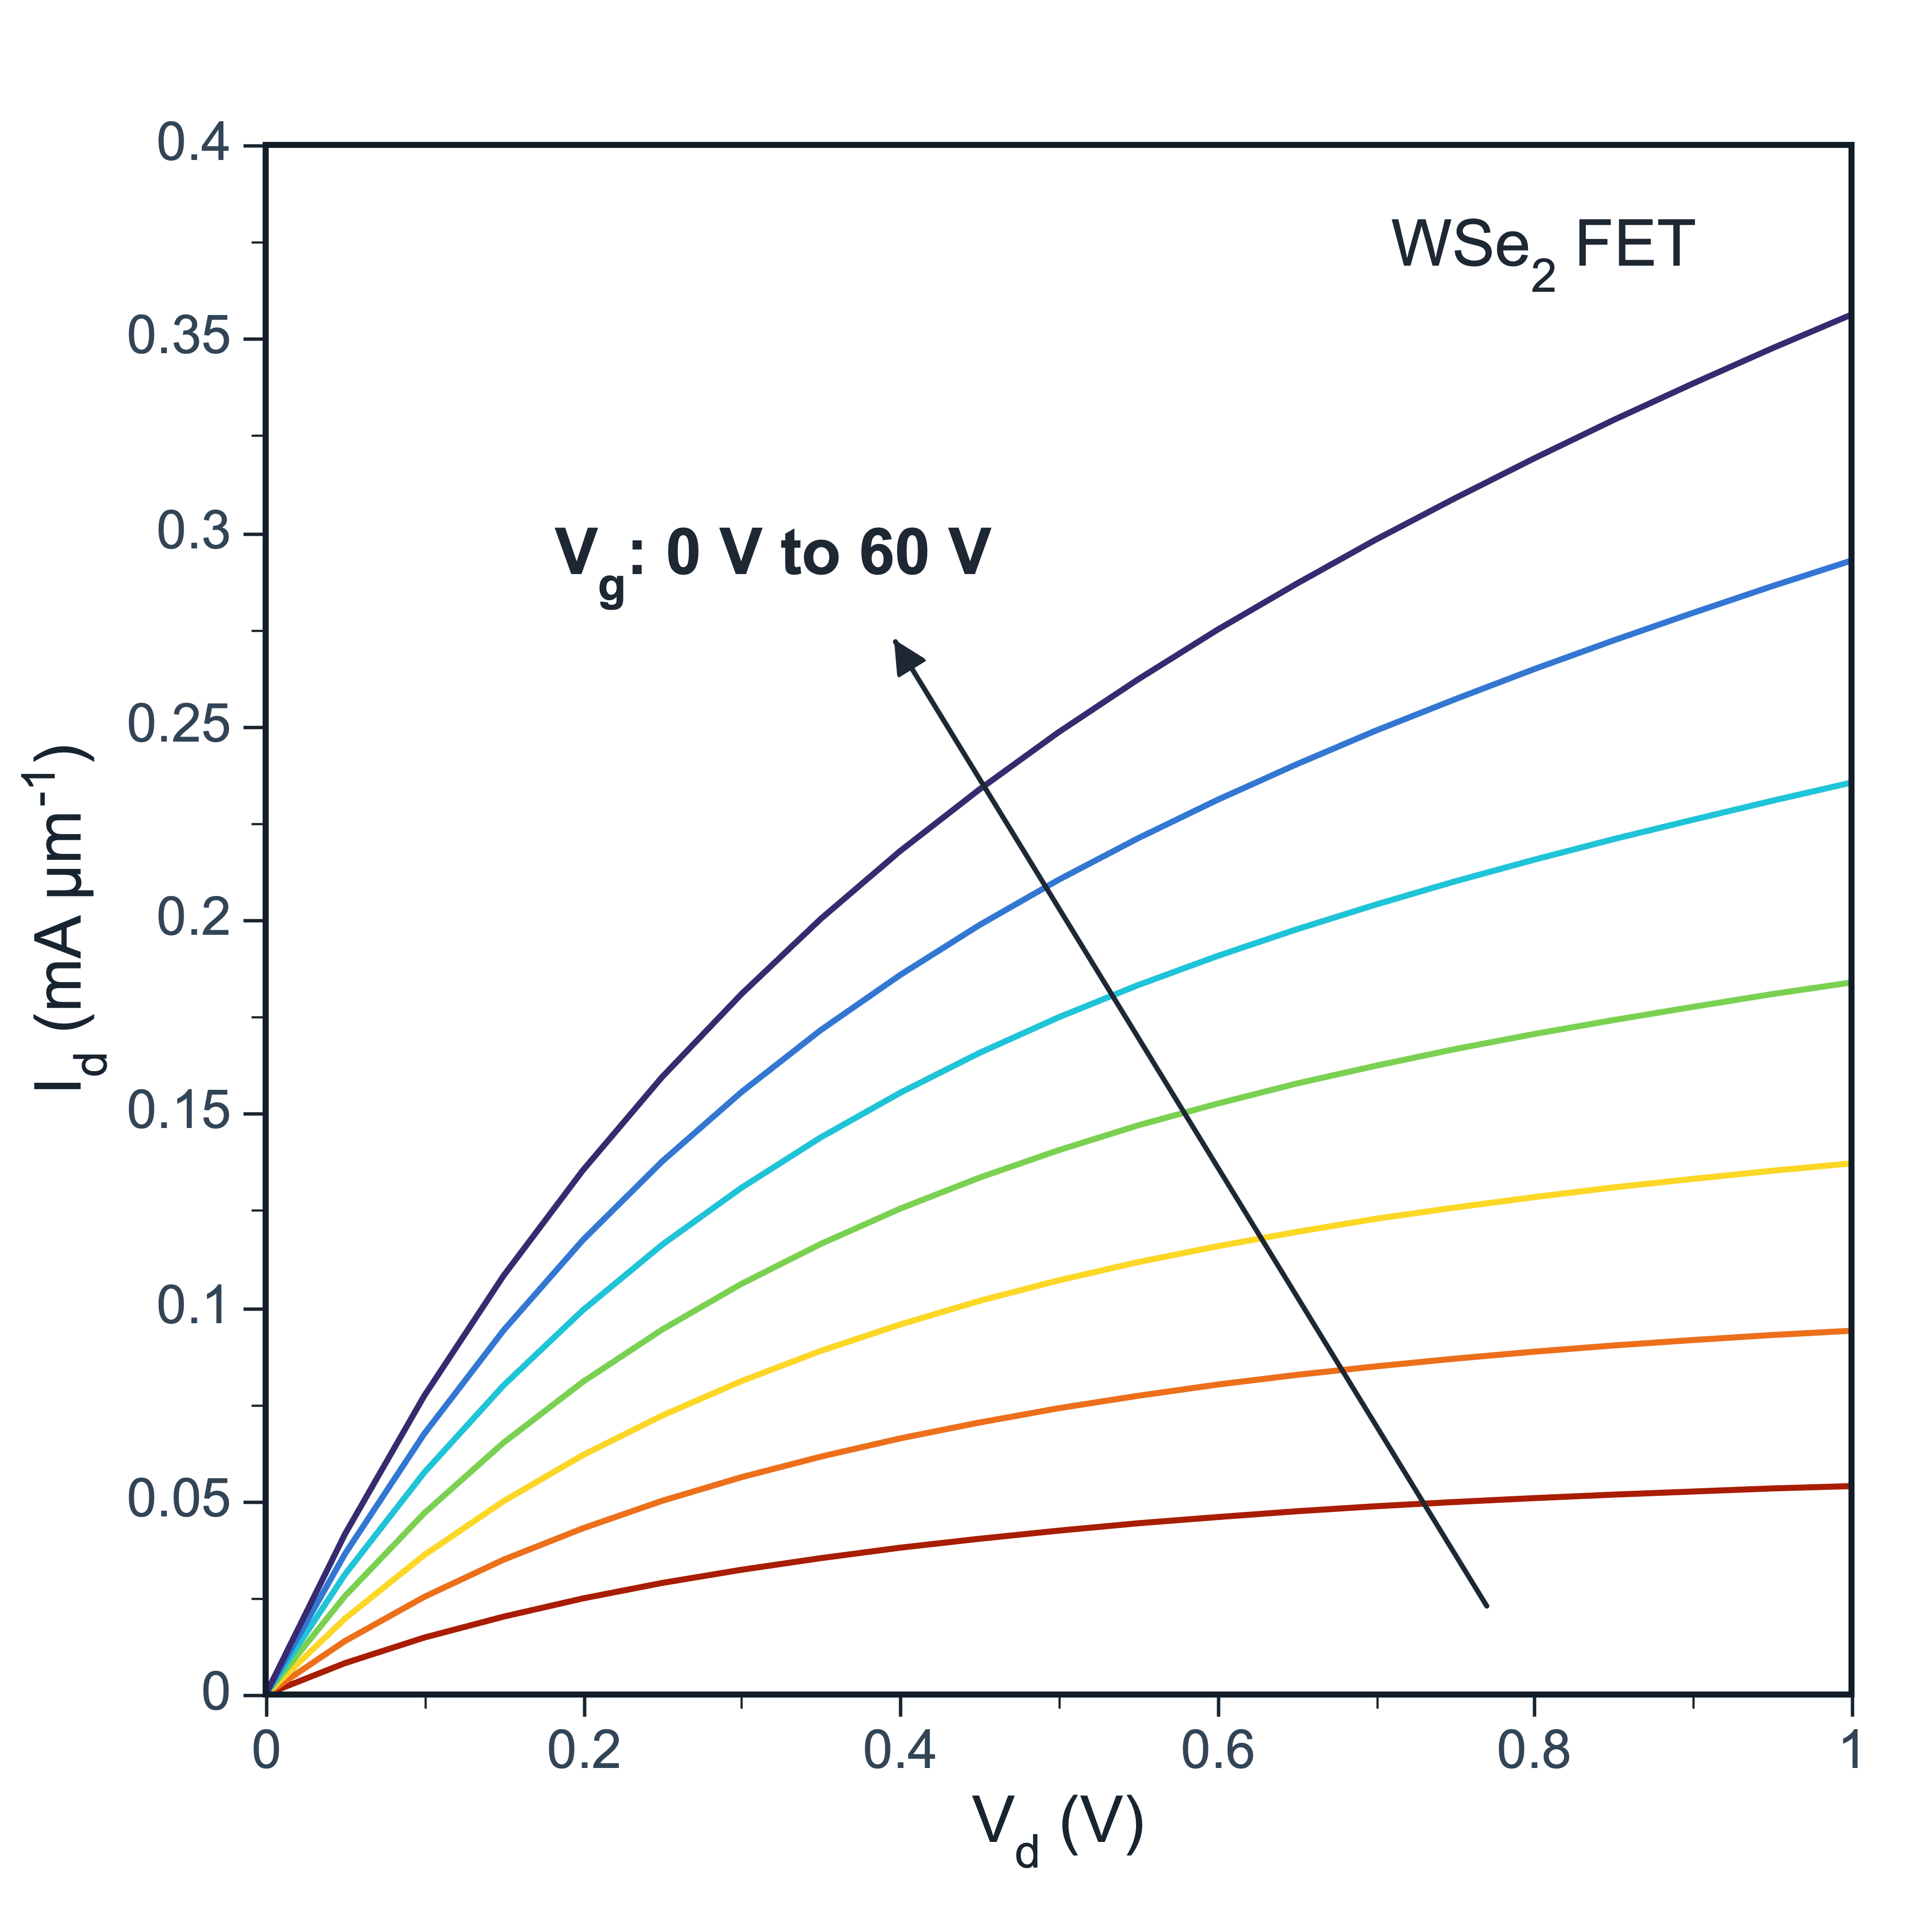
Line Plot
Follow change across a continuous sequence
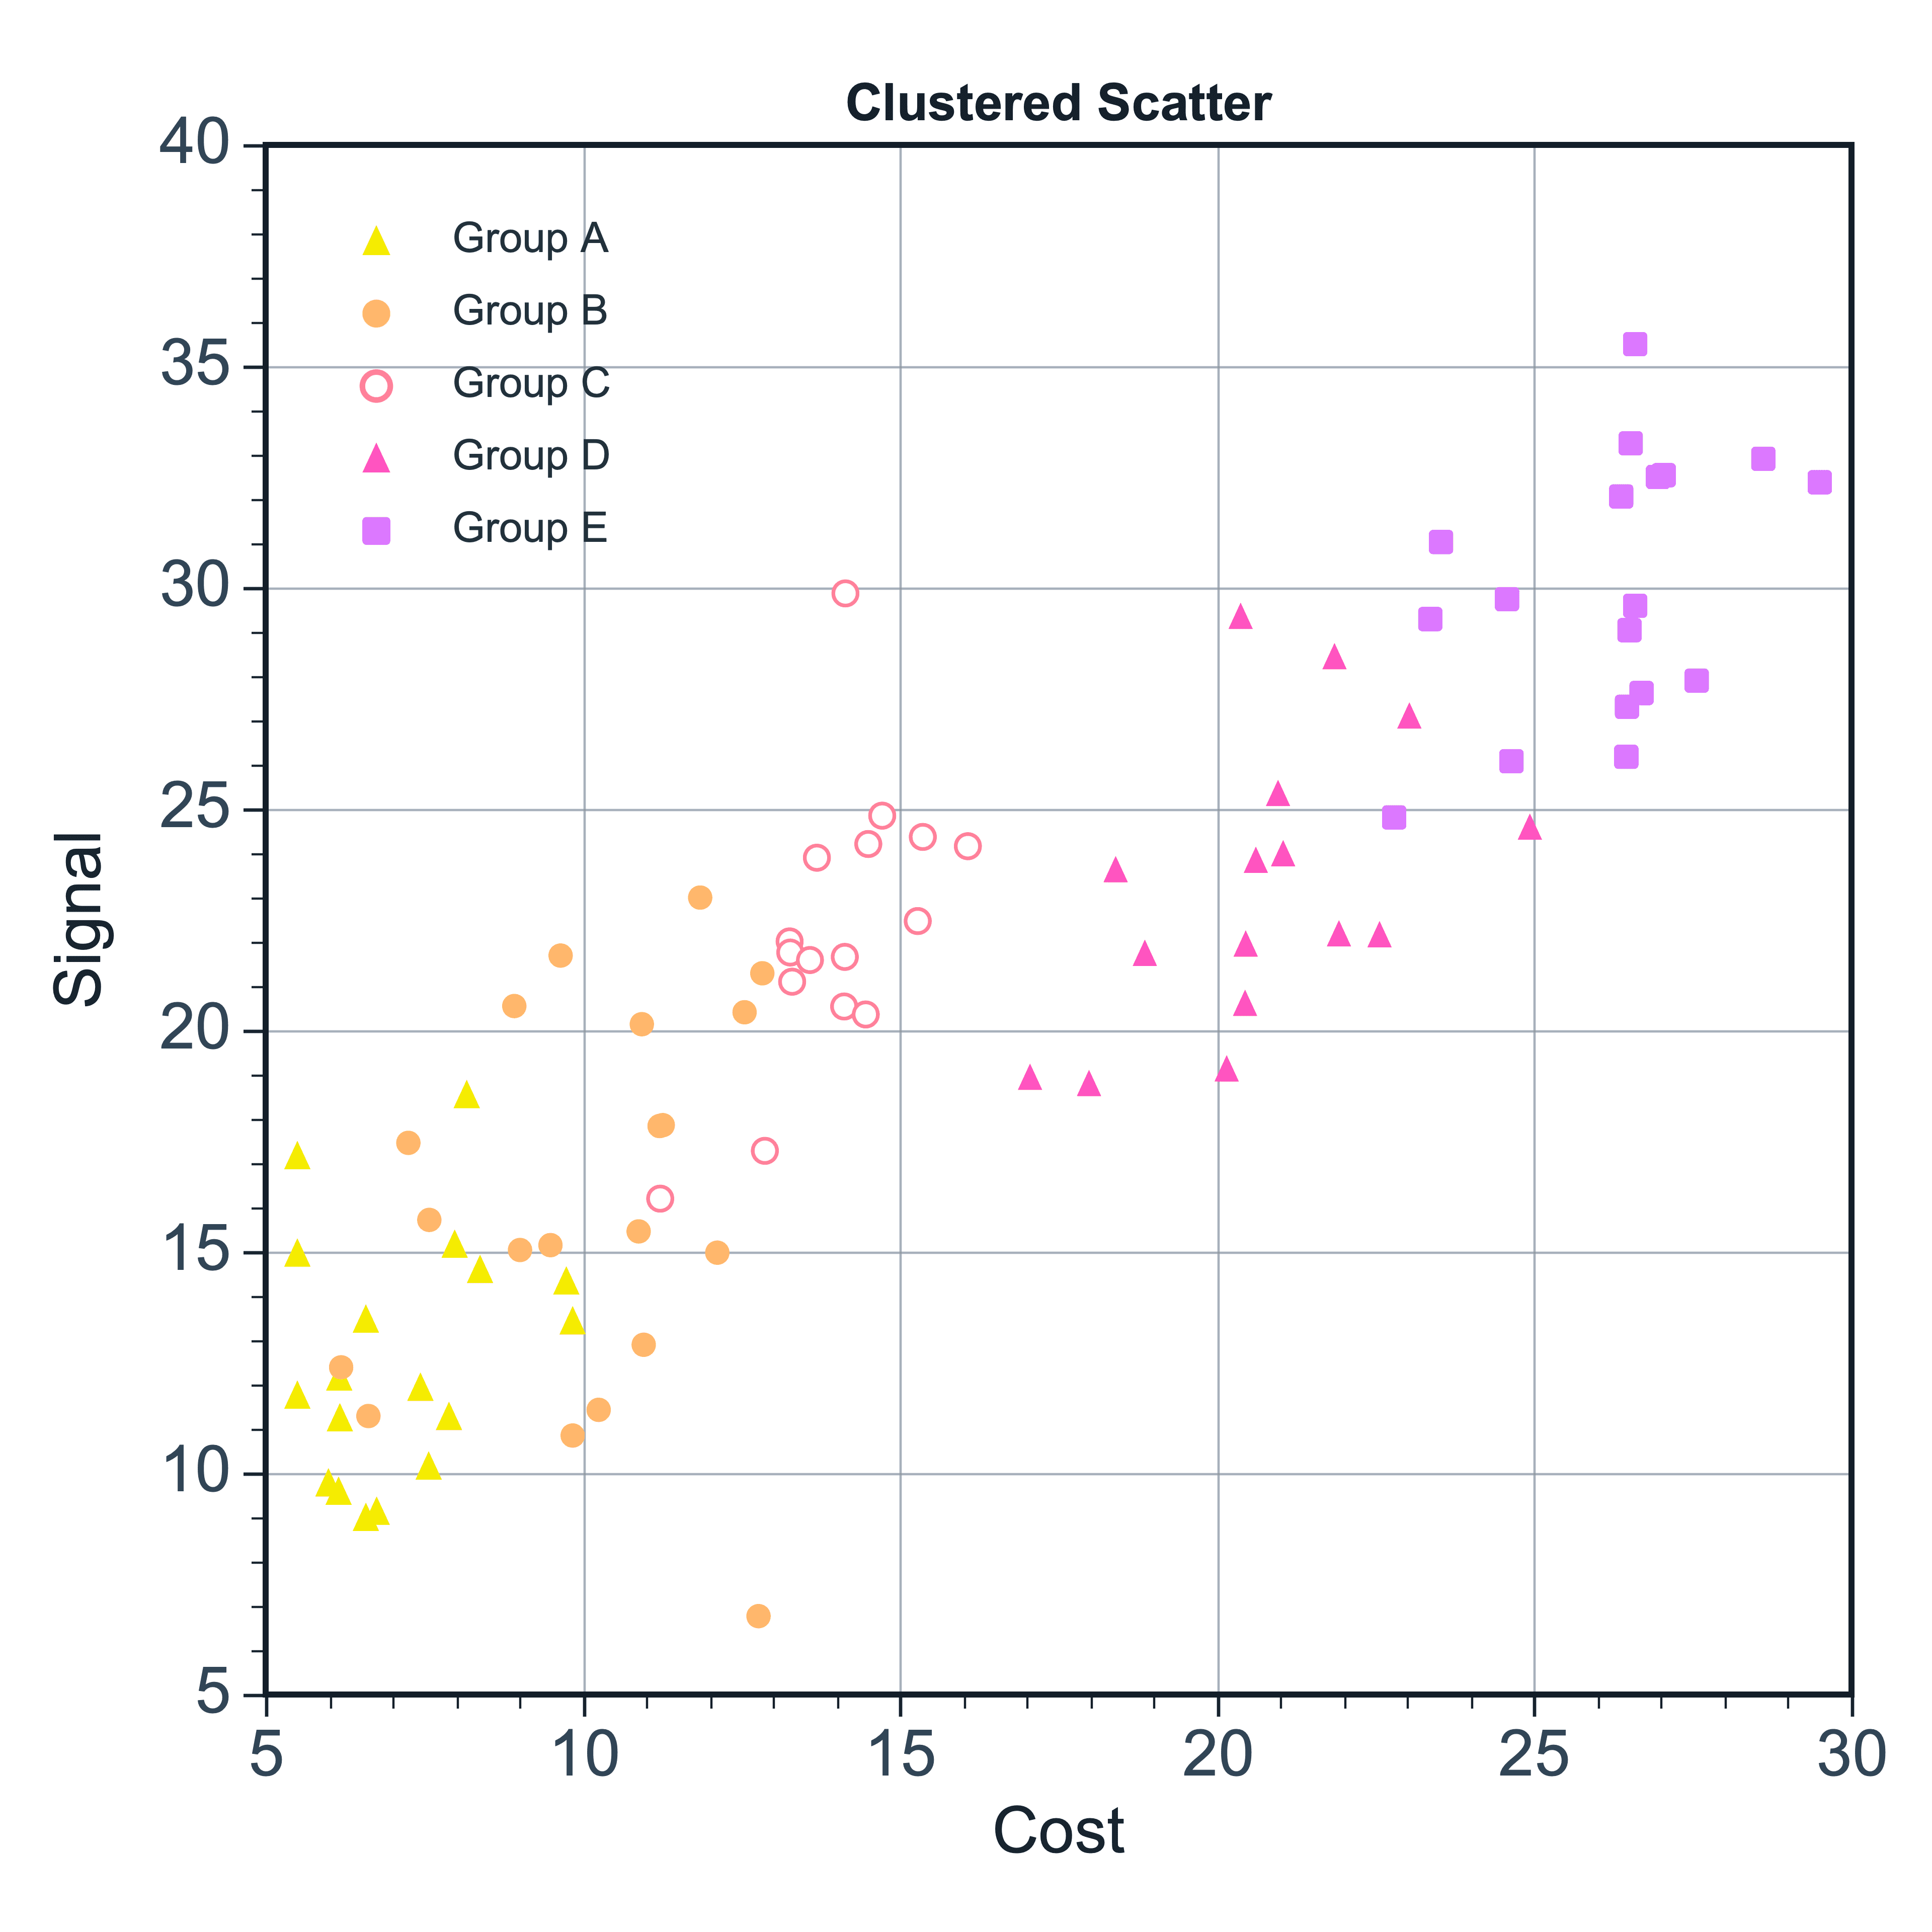
Scatter Plot
Inspect the relationship between two numeric variables
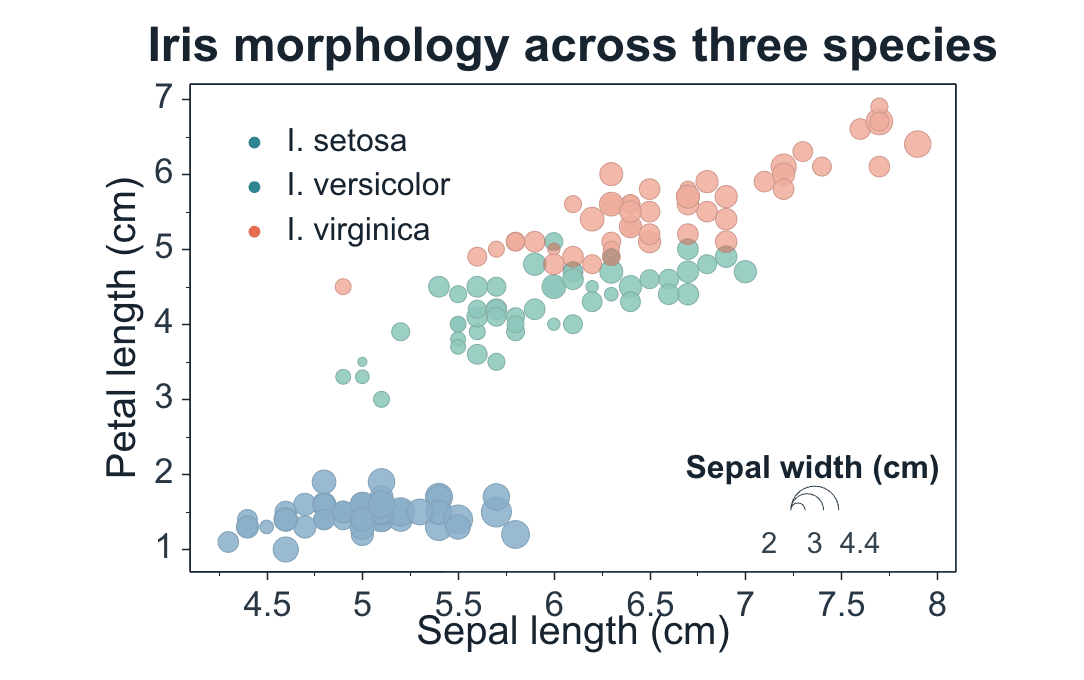
Bubble Chart
Add a third numeric dimension to point position
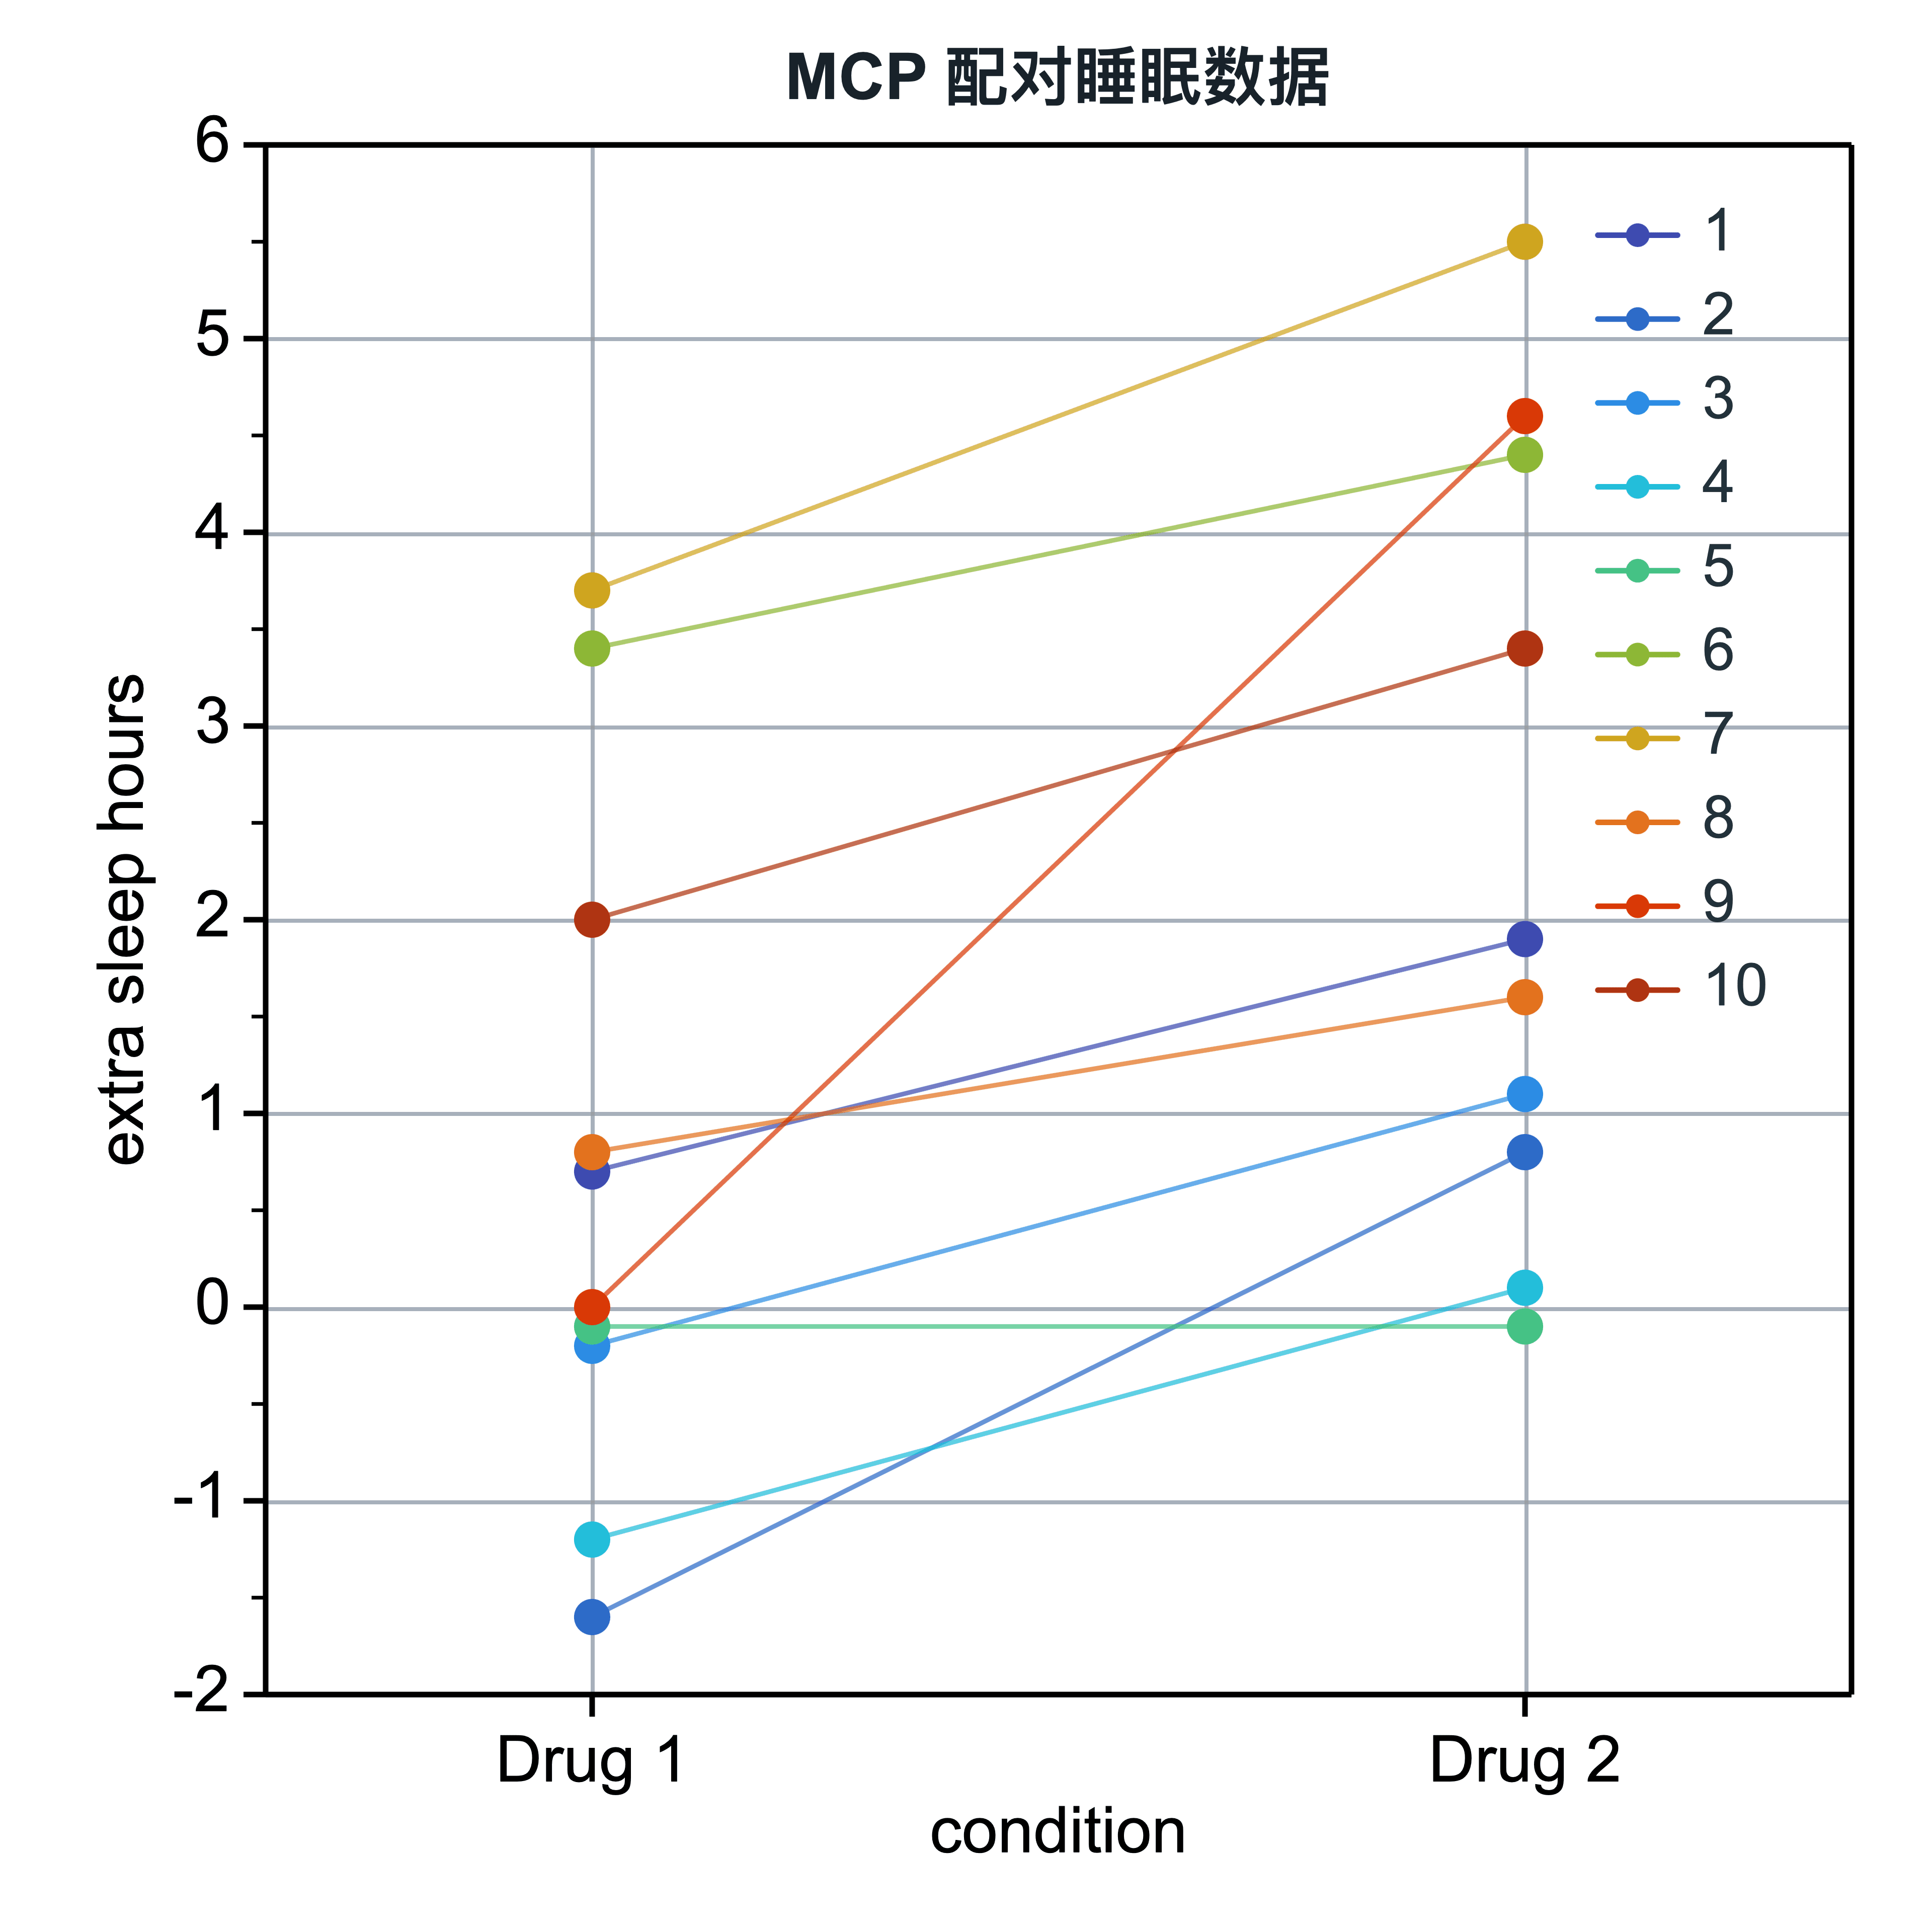
Paired Scatter
Compare the same subjects across conditions
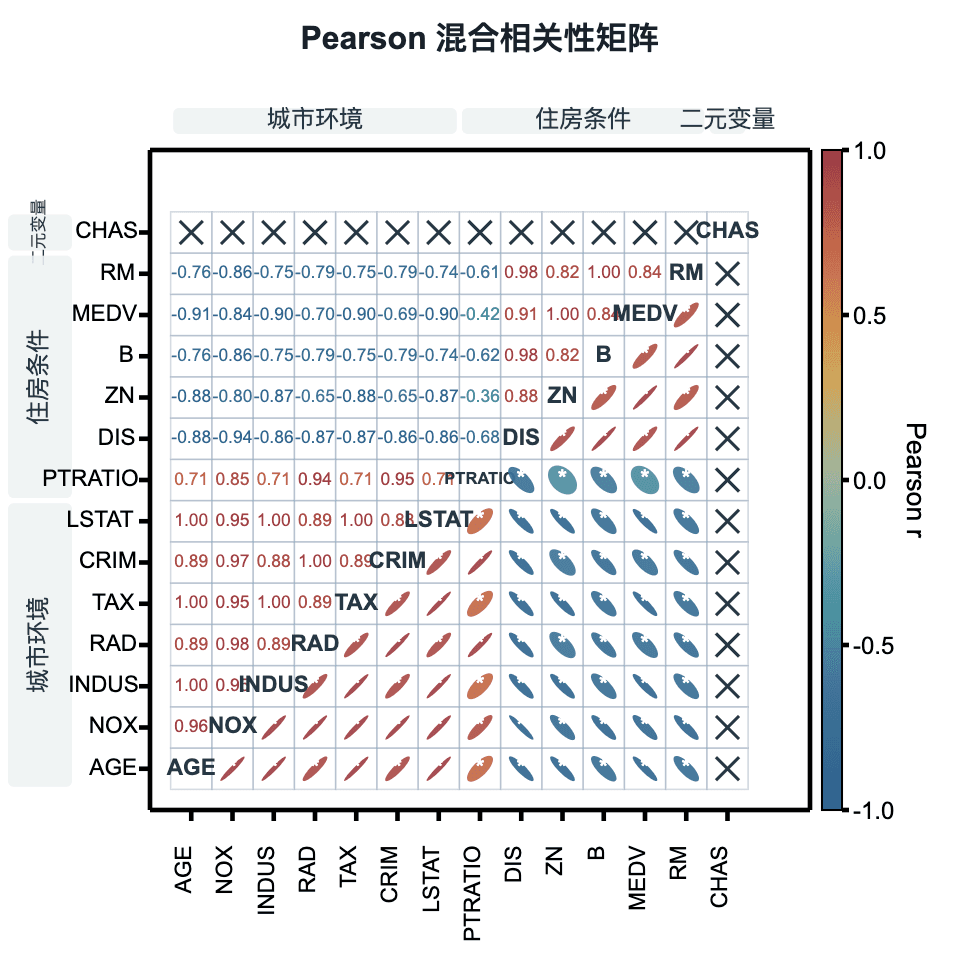
Mixed Correlation Matrix
Review correlations across many variables
Category comparison
Compare category magnitudes, different scales, or shared metrics.
Category + 1–many values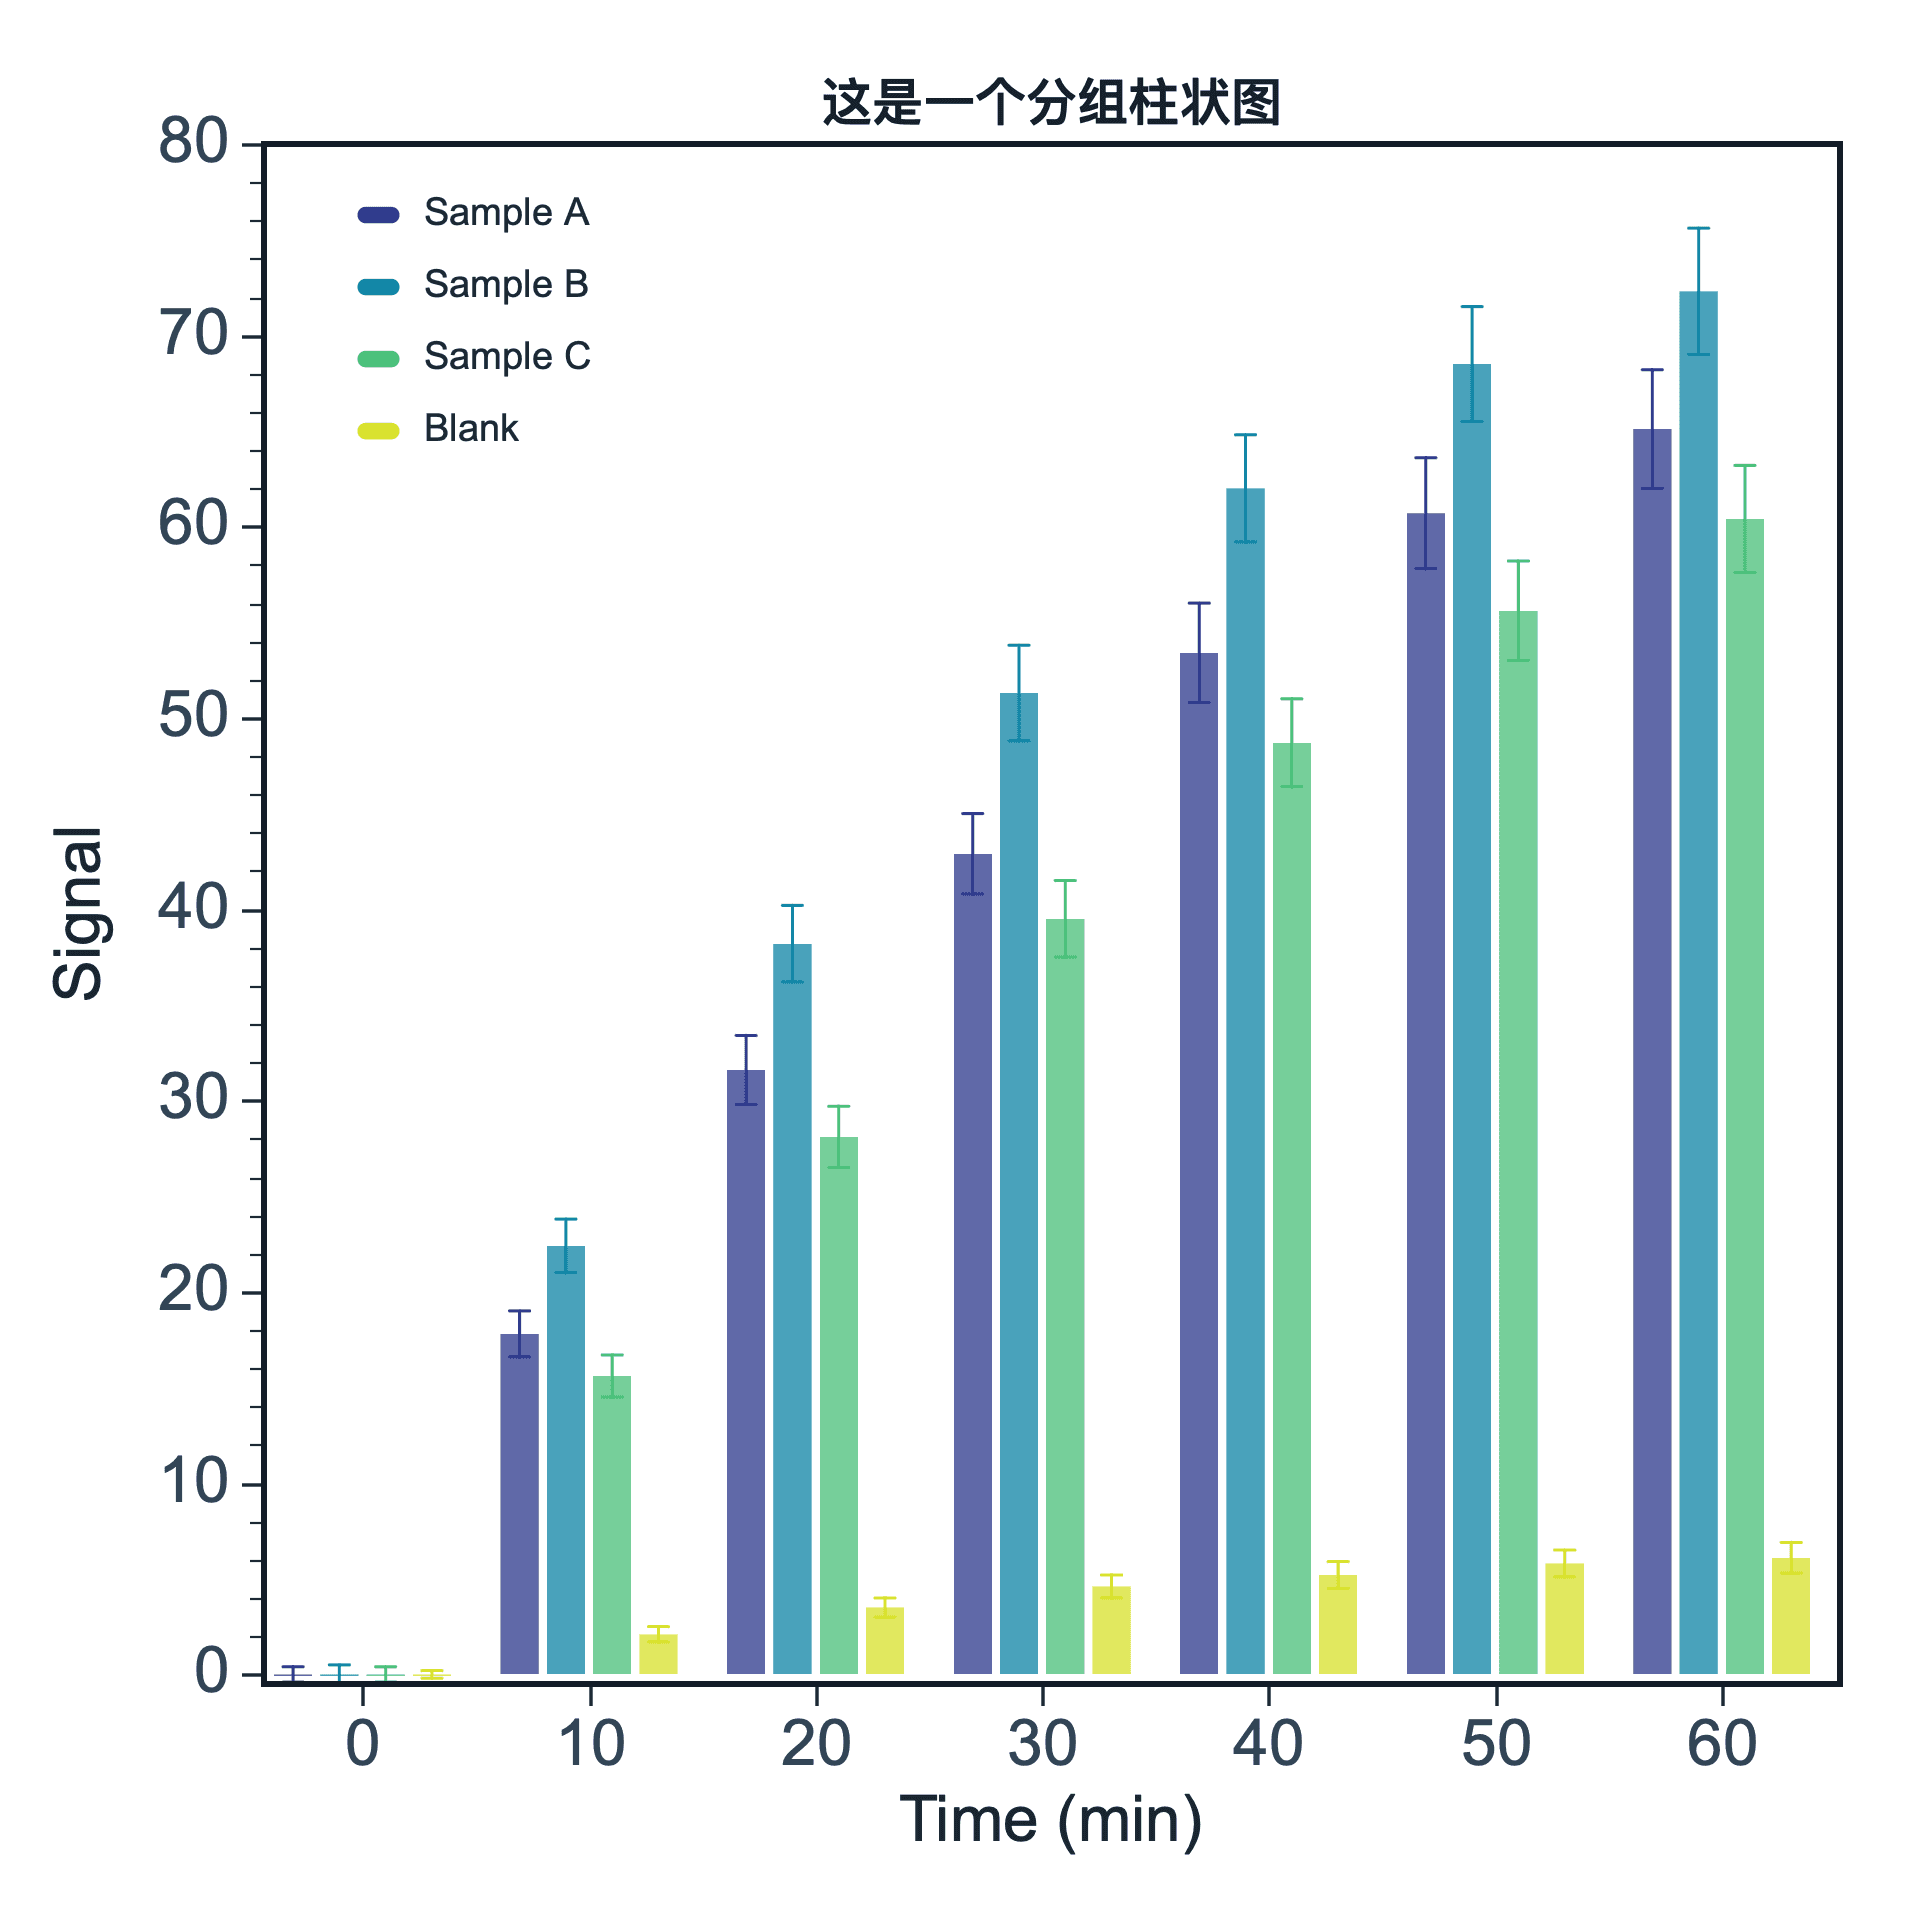
Bar Chart
Compare values across categories directly
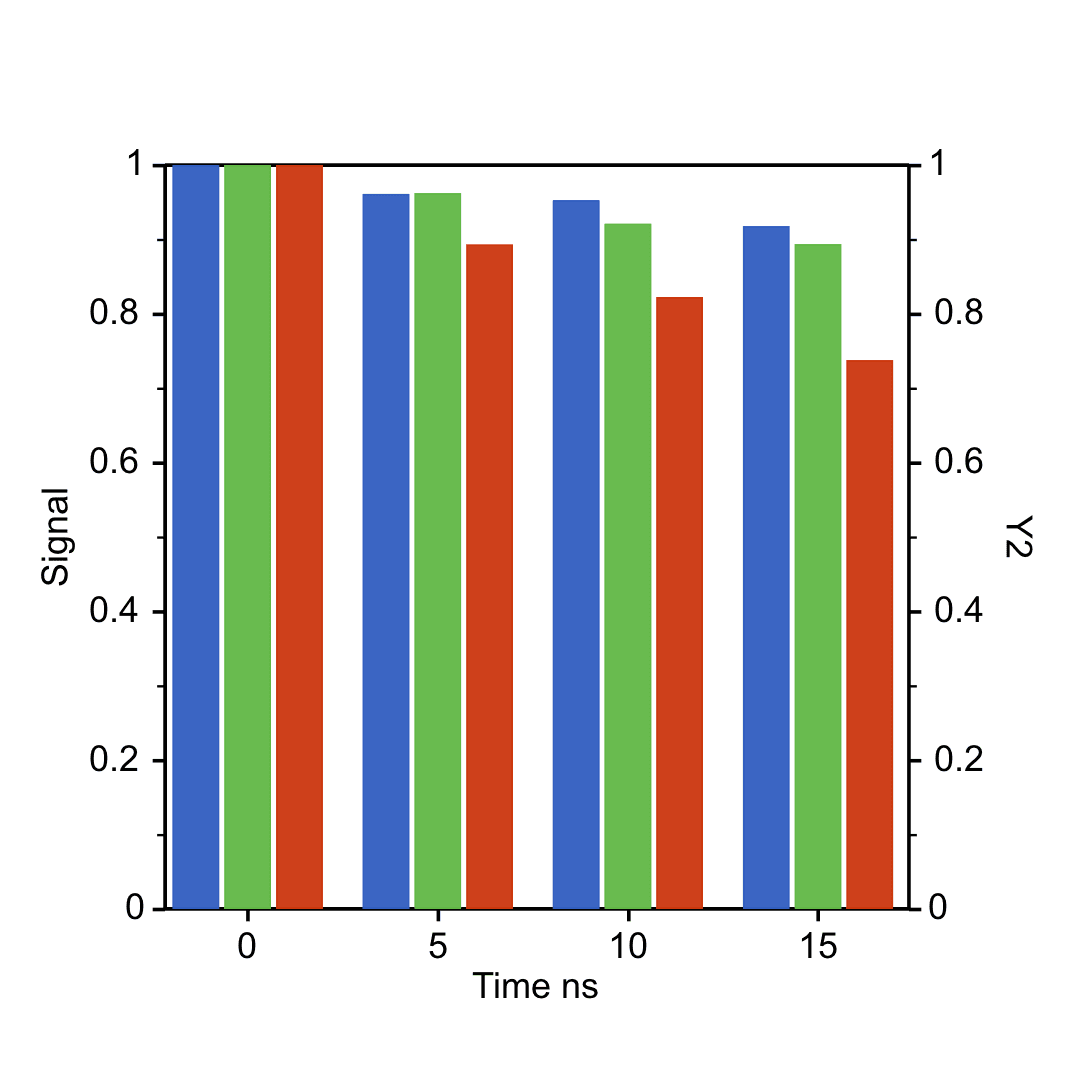
Dual Y Bar Chart
Place differently scaled category values side by side
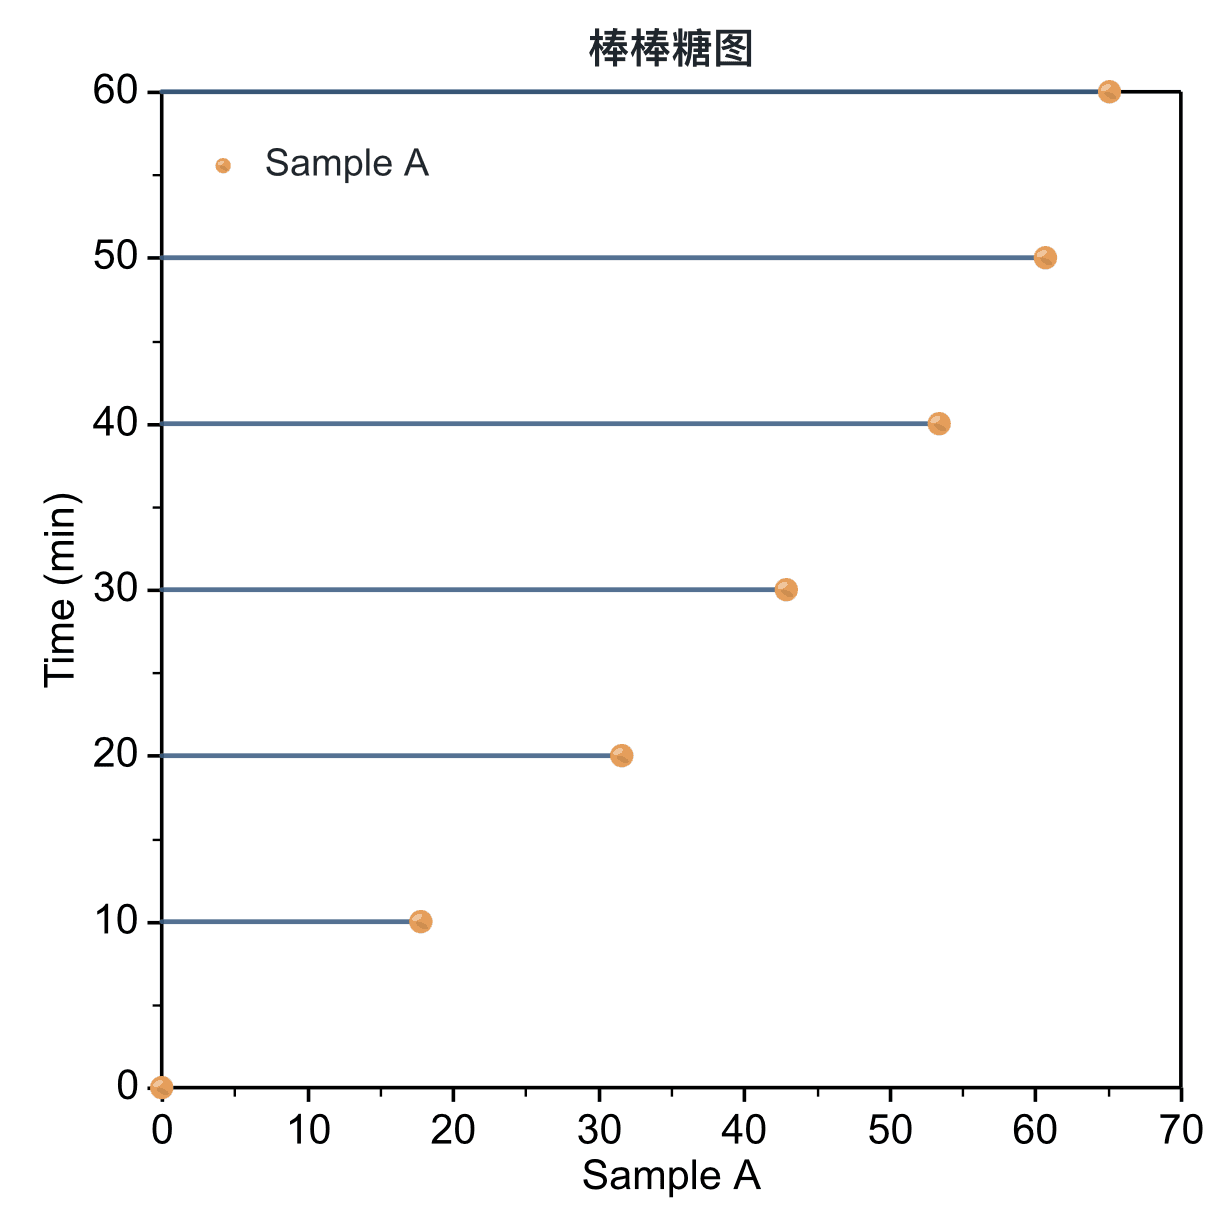
Lollipop Plot
Emphasize exact values with less visual weight
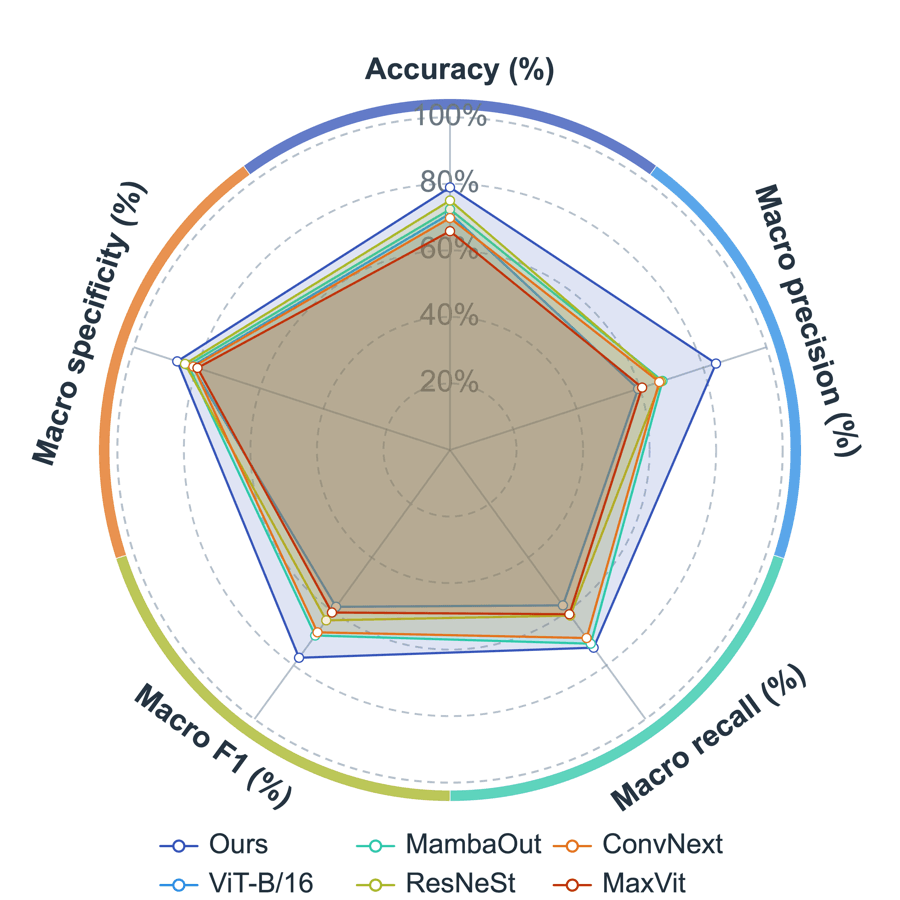
Radar Chart
Compare objects across a shared set of metrics
Composition & sets
Show shares of a whole, amplify category differences, or inspect set overlap.
Category + non-negative value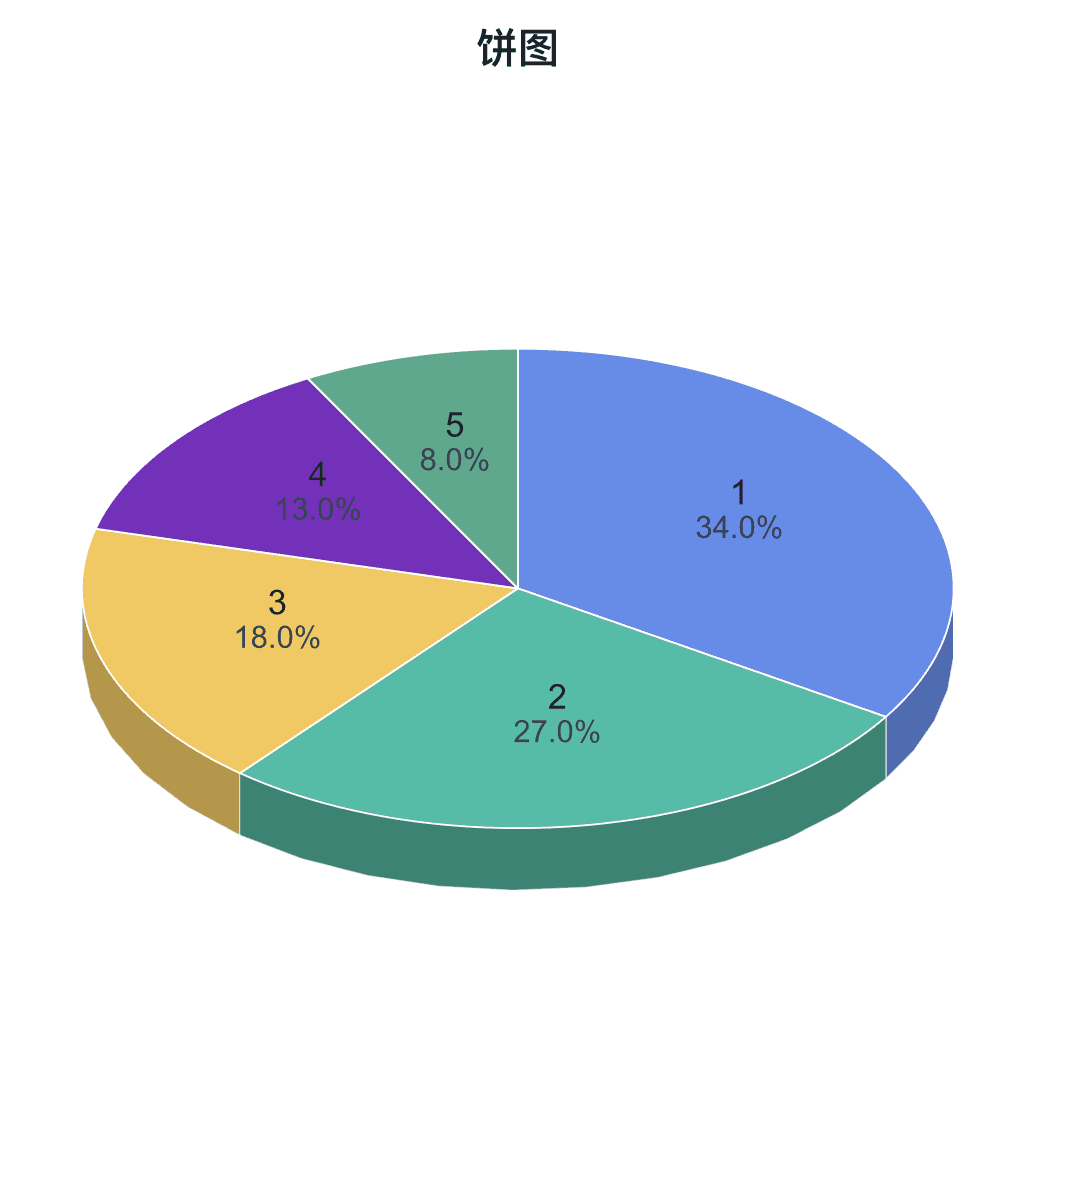
Pie Chart
Show how a few exclusive categories form a whole
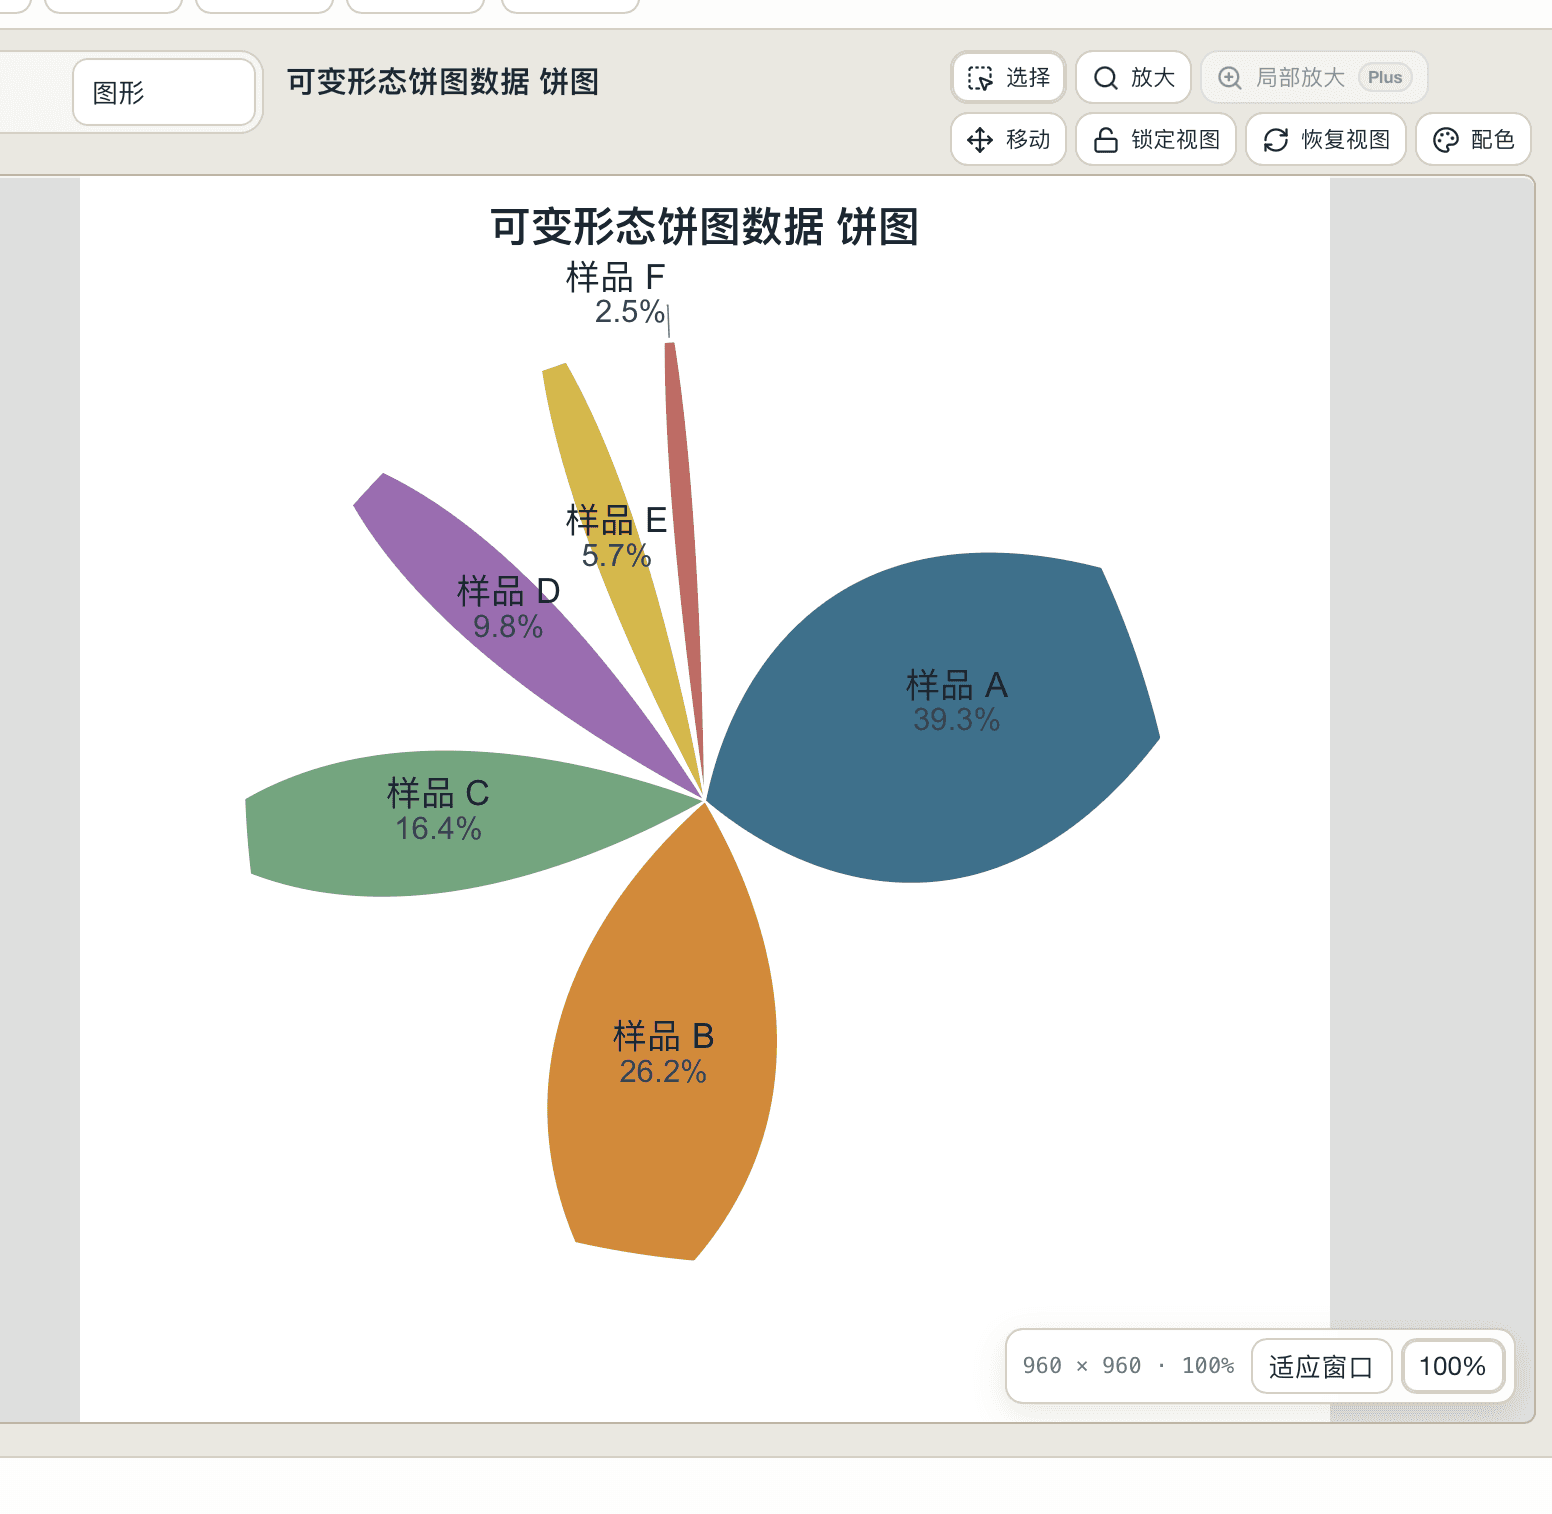
Variable-form Pie
Use variable radii to emphasize category differences
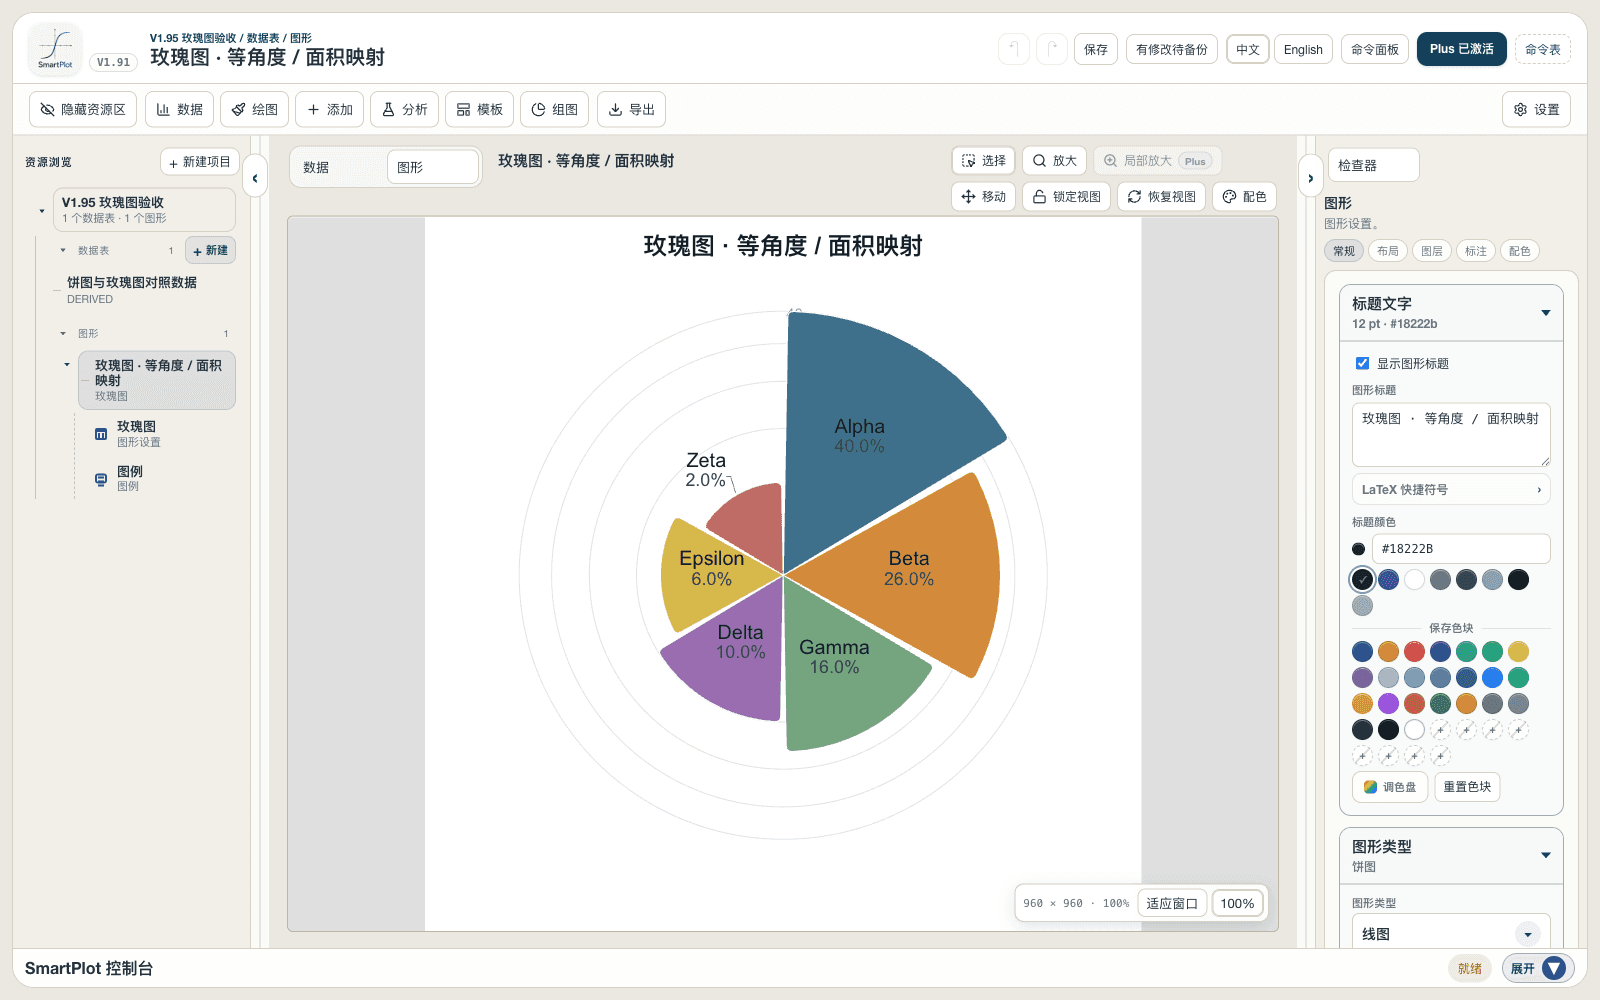
Rose Chart
Compare categories with equal-angle sectors
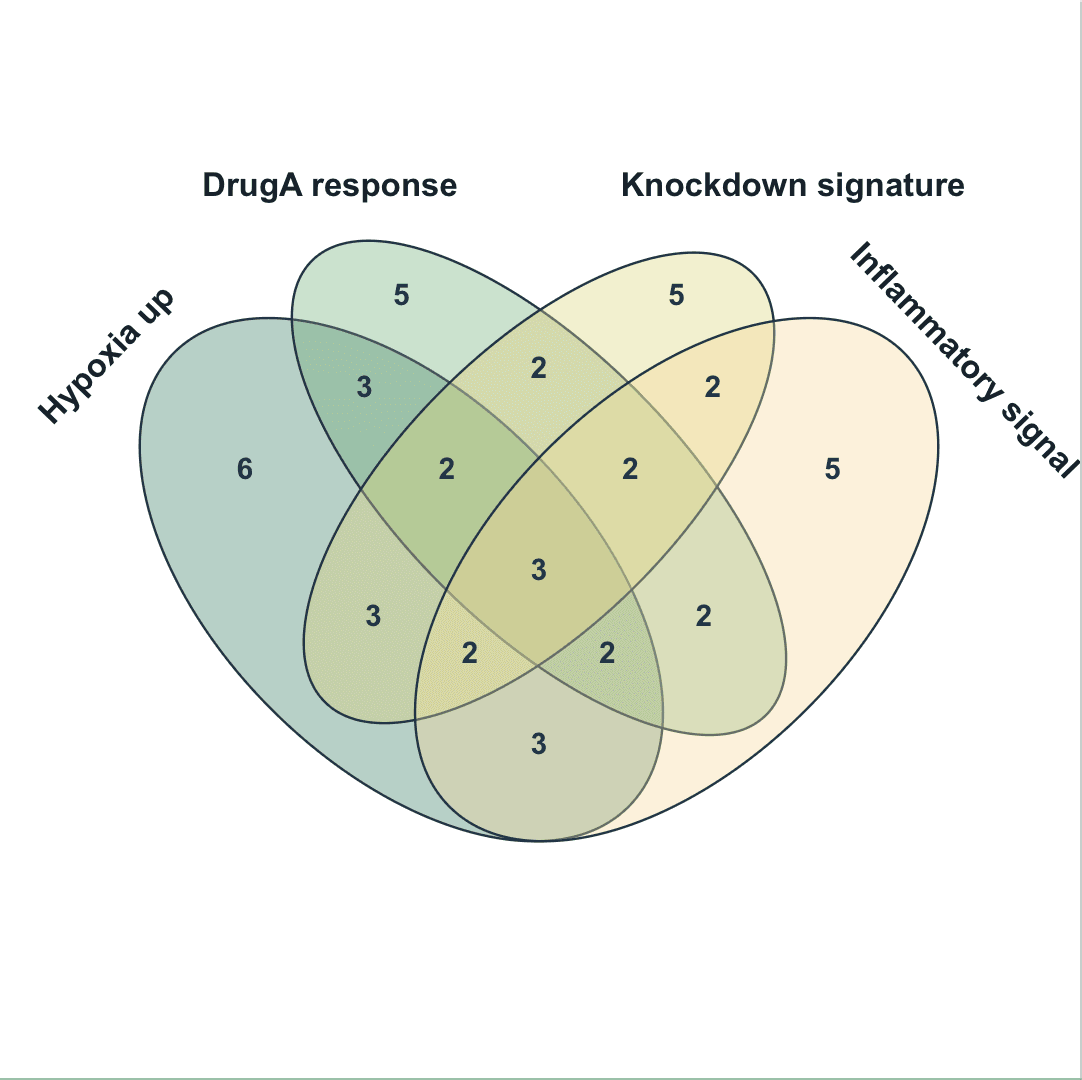
Venn Diagram
See unique and shared members across 2–4 sets
Distribution & difference
Inspect numeric shape, group summaries, raw observations, and significance.
1–many continuous value columns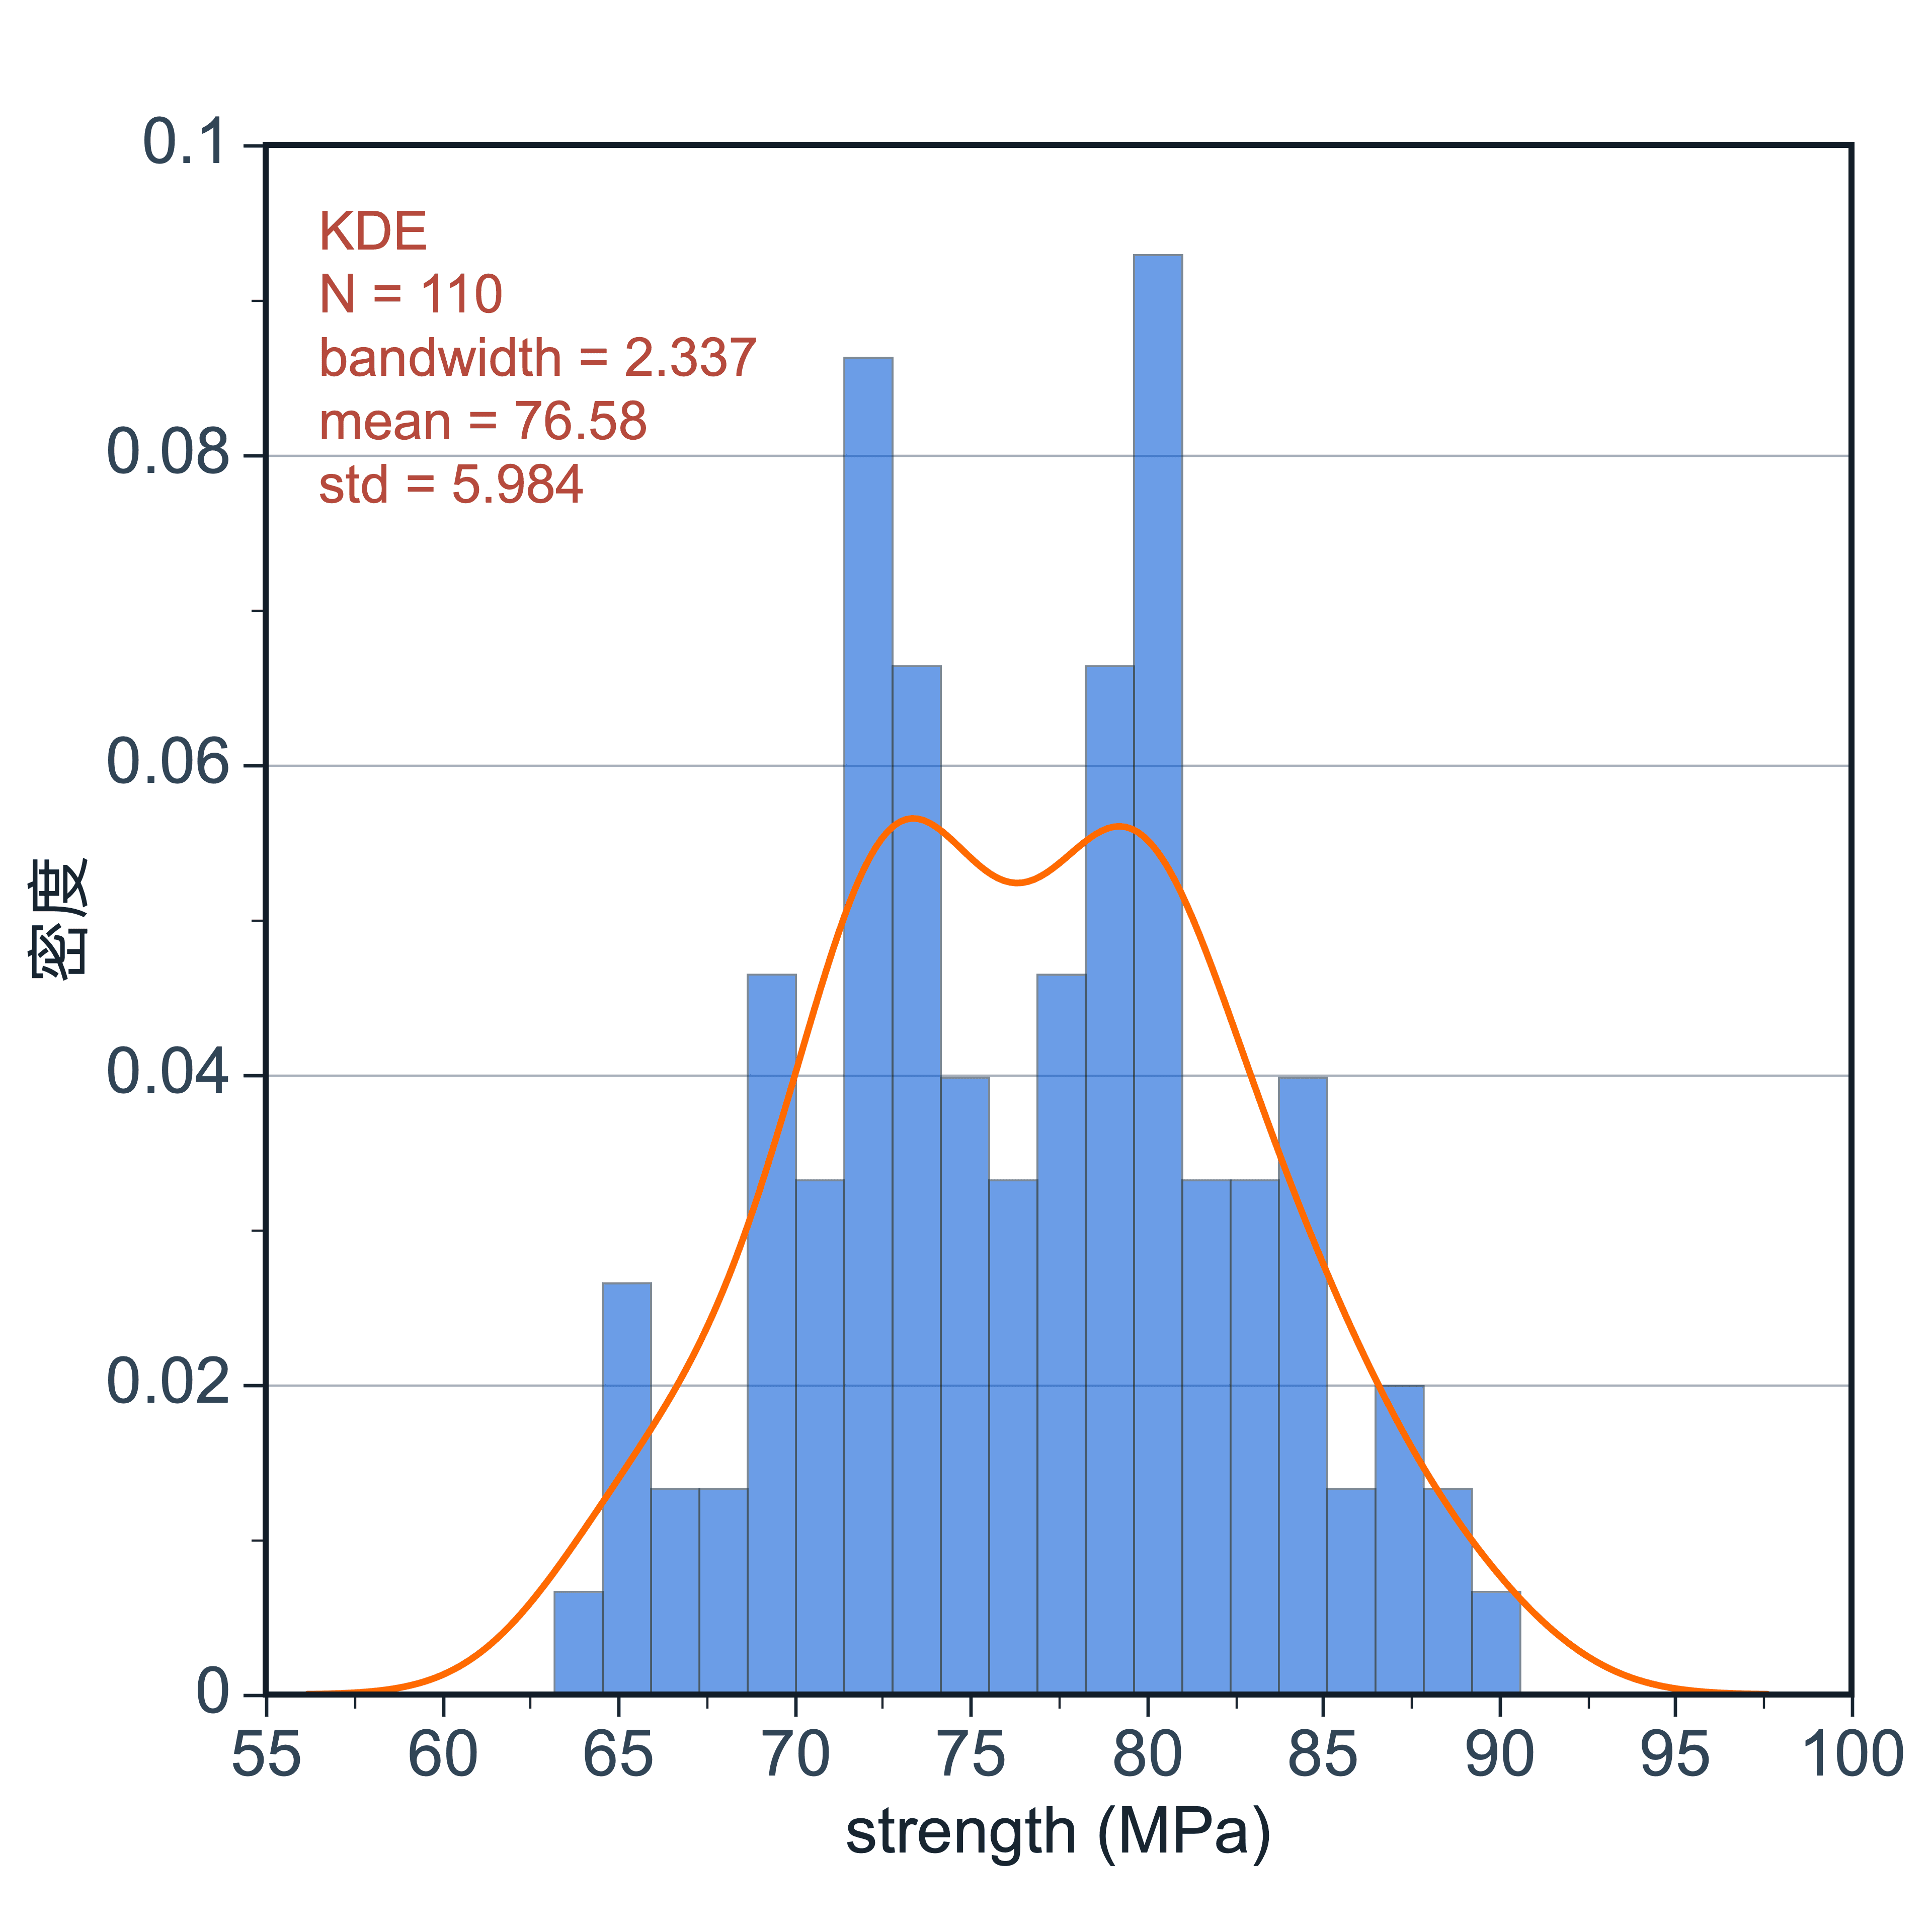
Histogram
Inspect frequency and shape in continuous values
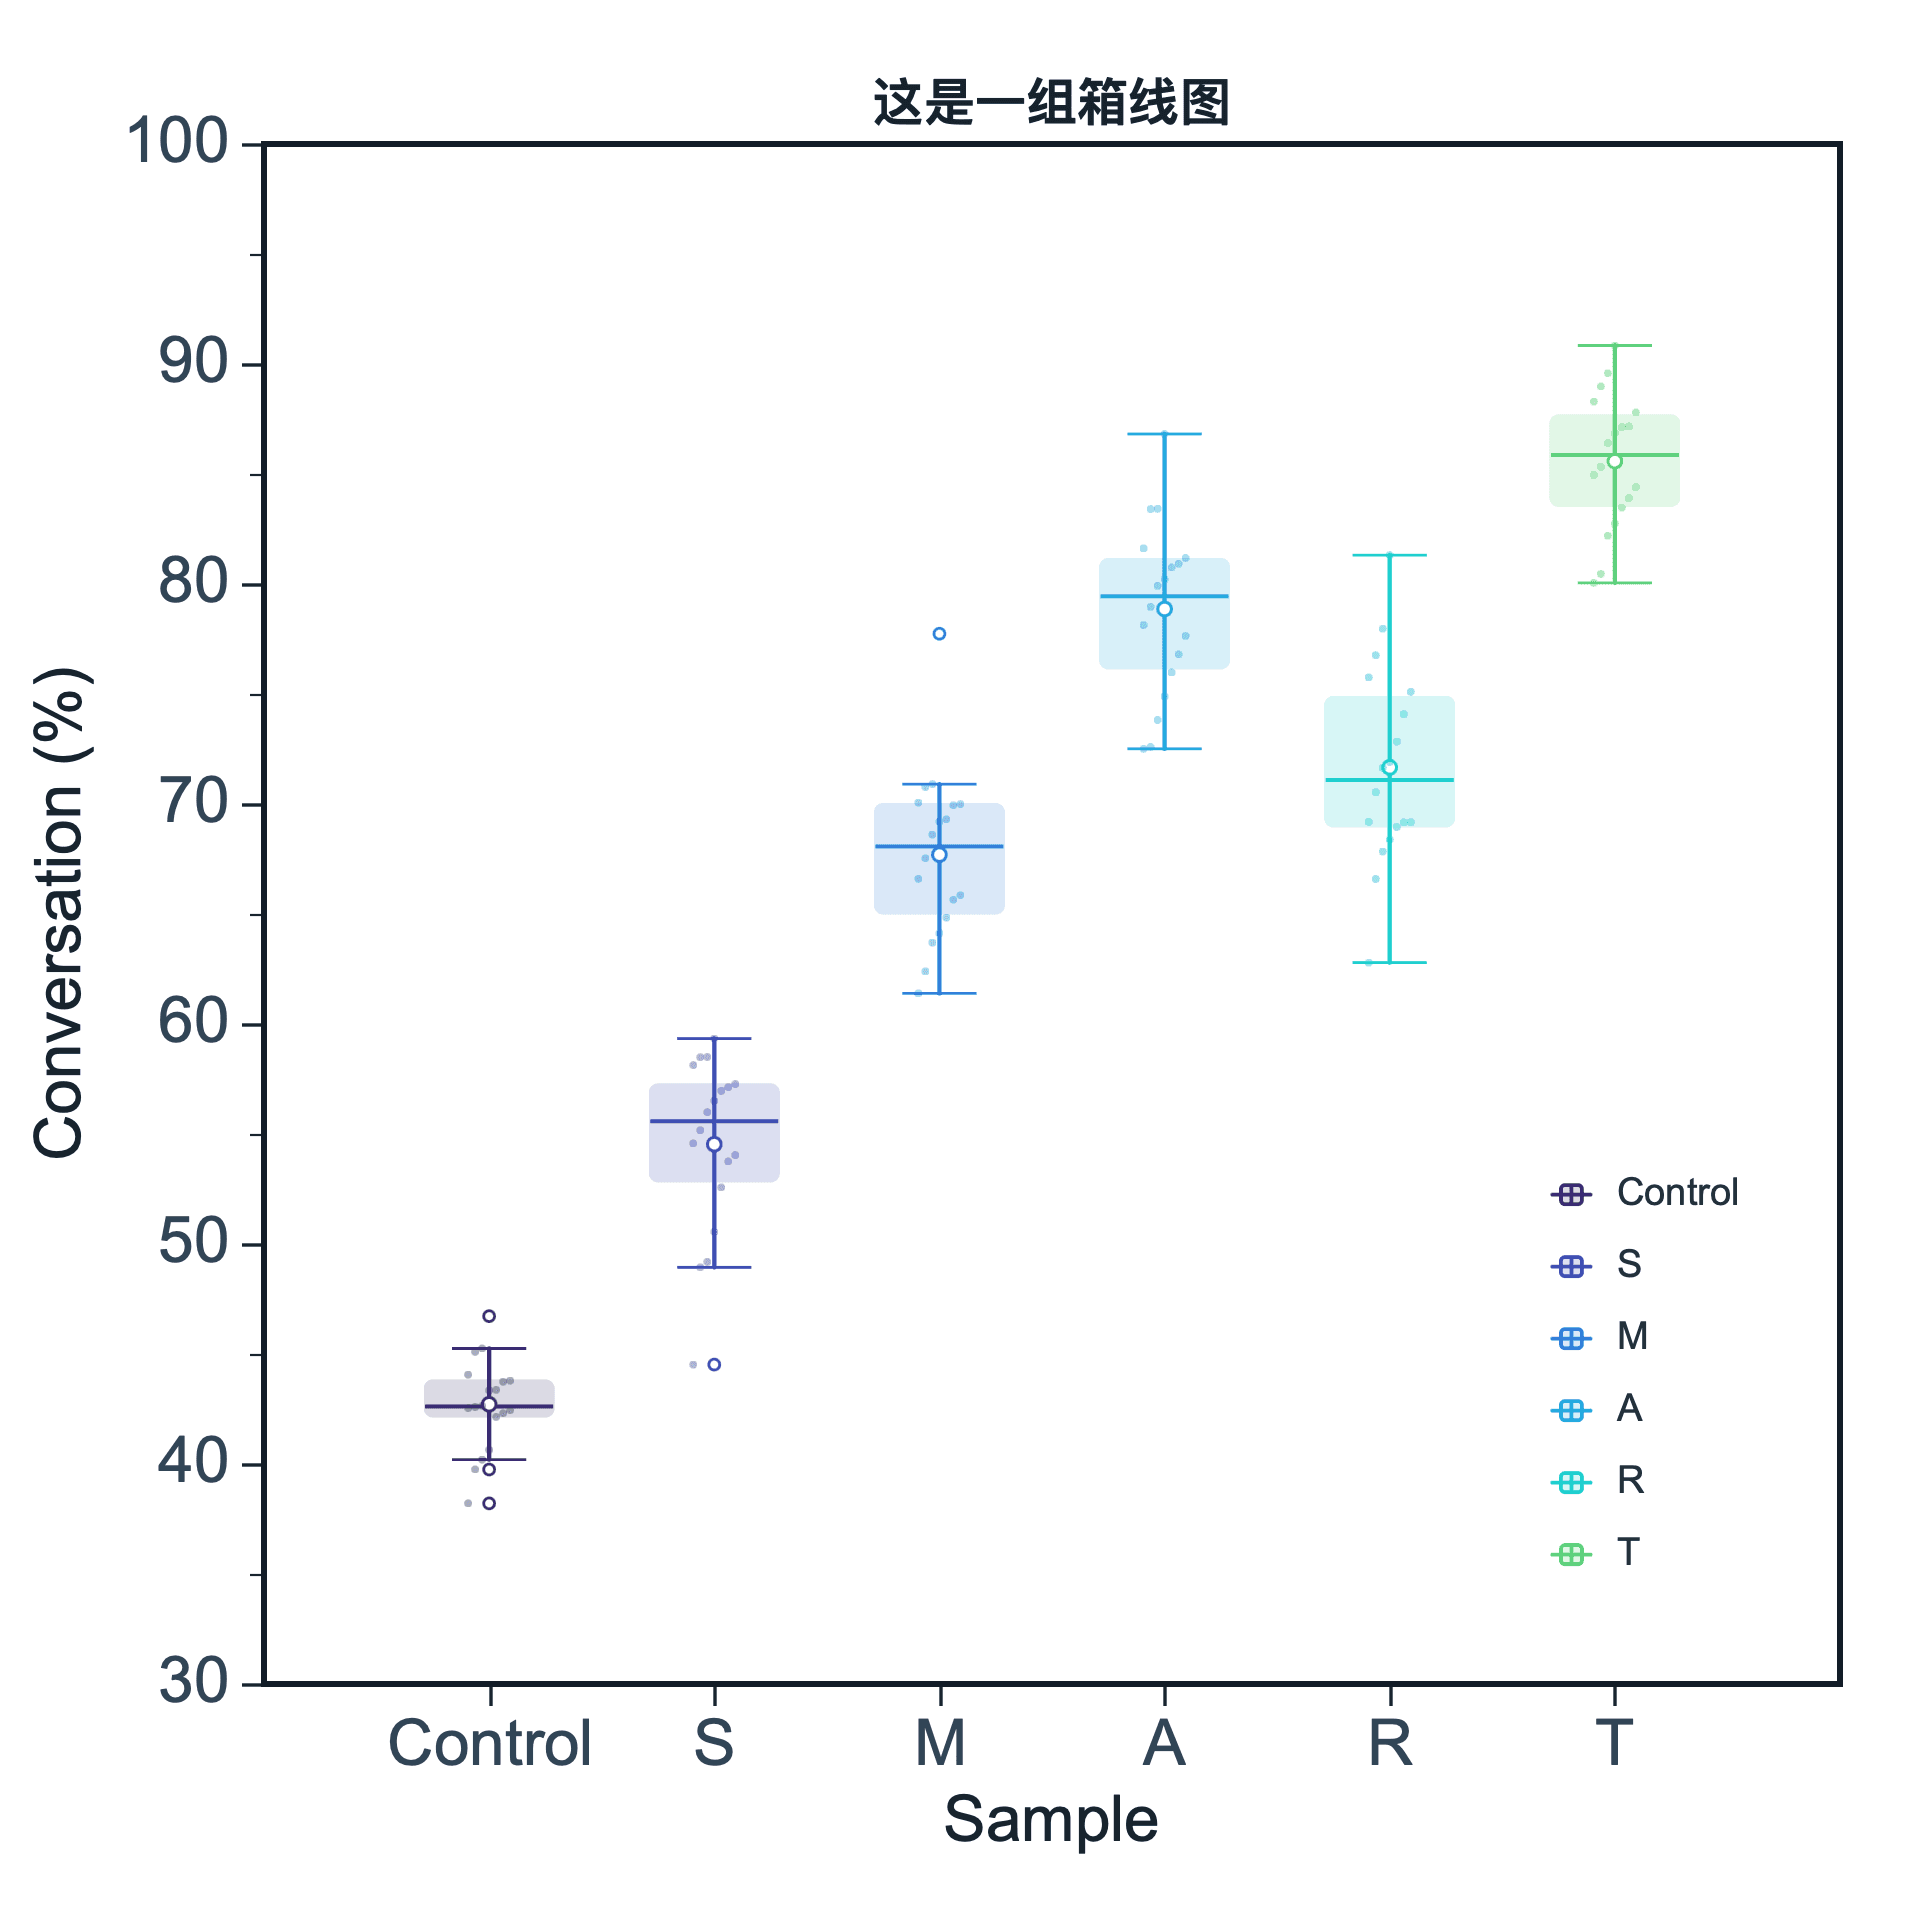
Box Plot
Summarize and compare grouped distributions and outliers
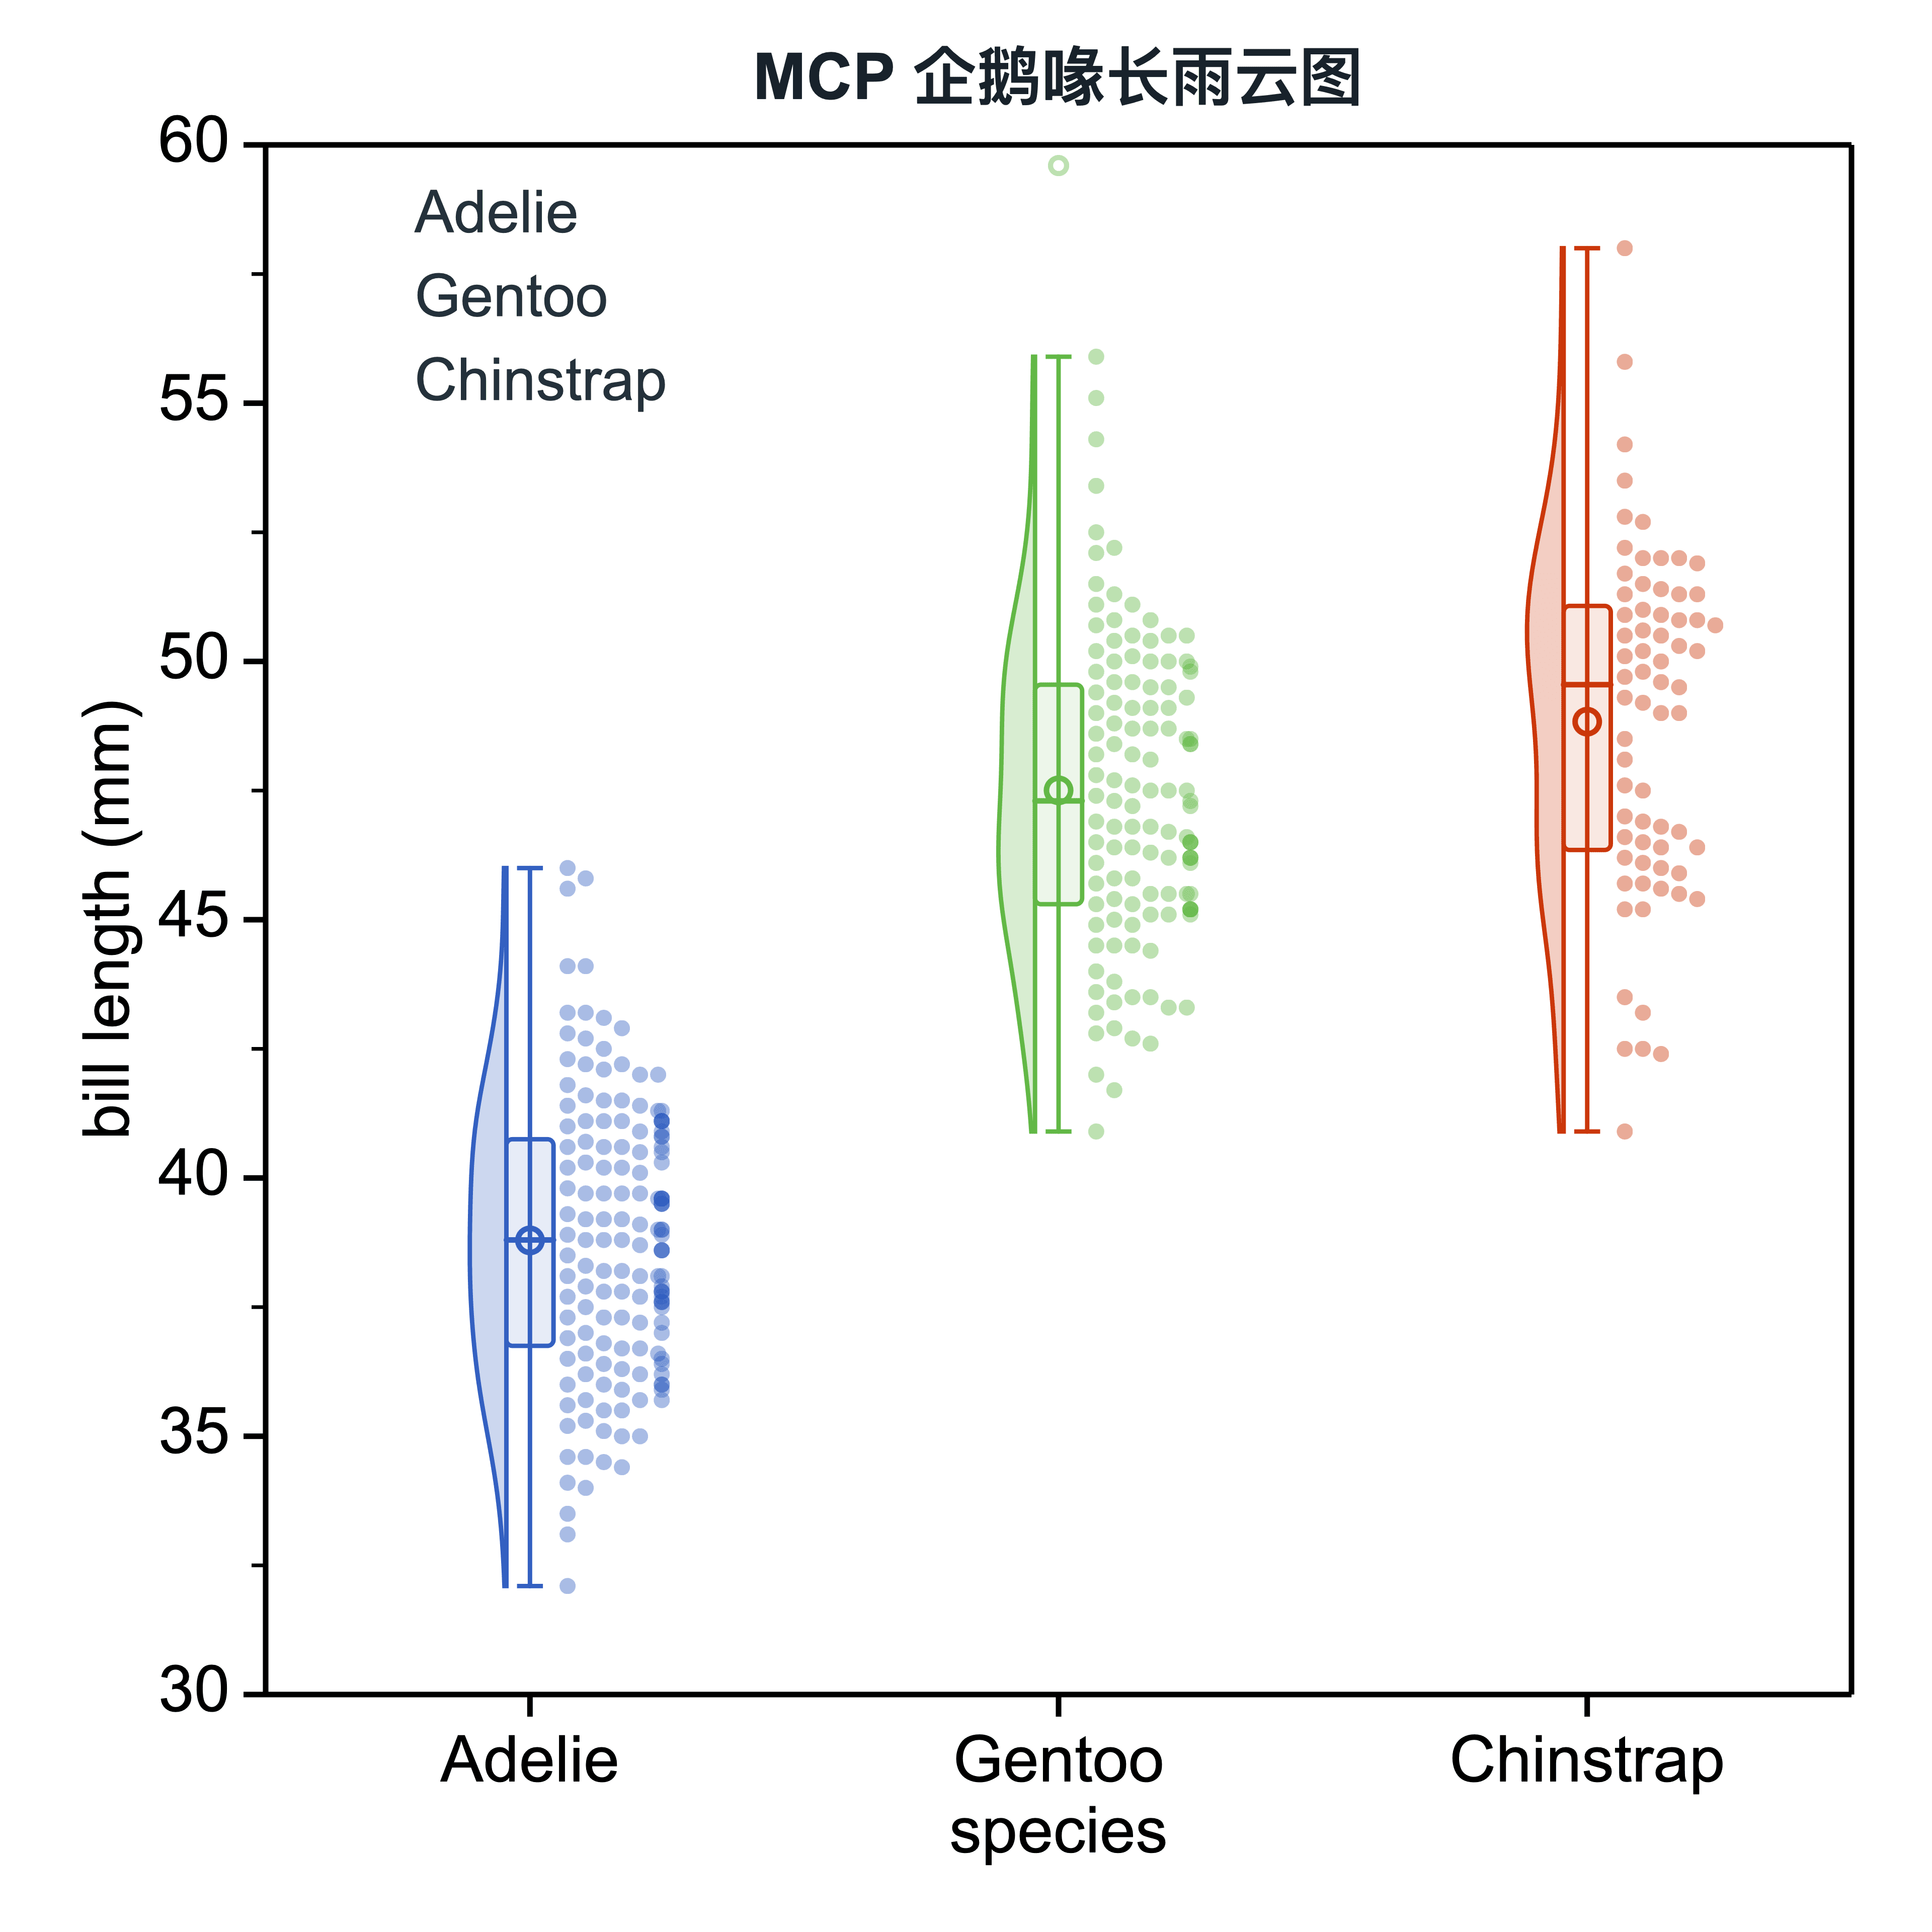
Raincloud Plot
See density, summary statistics, and raw points together
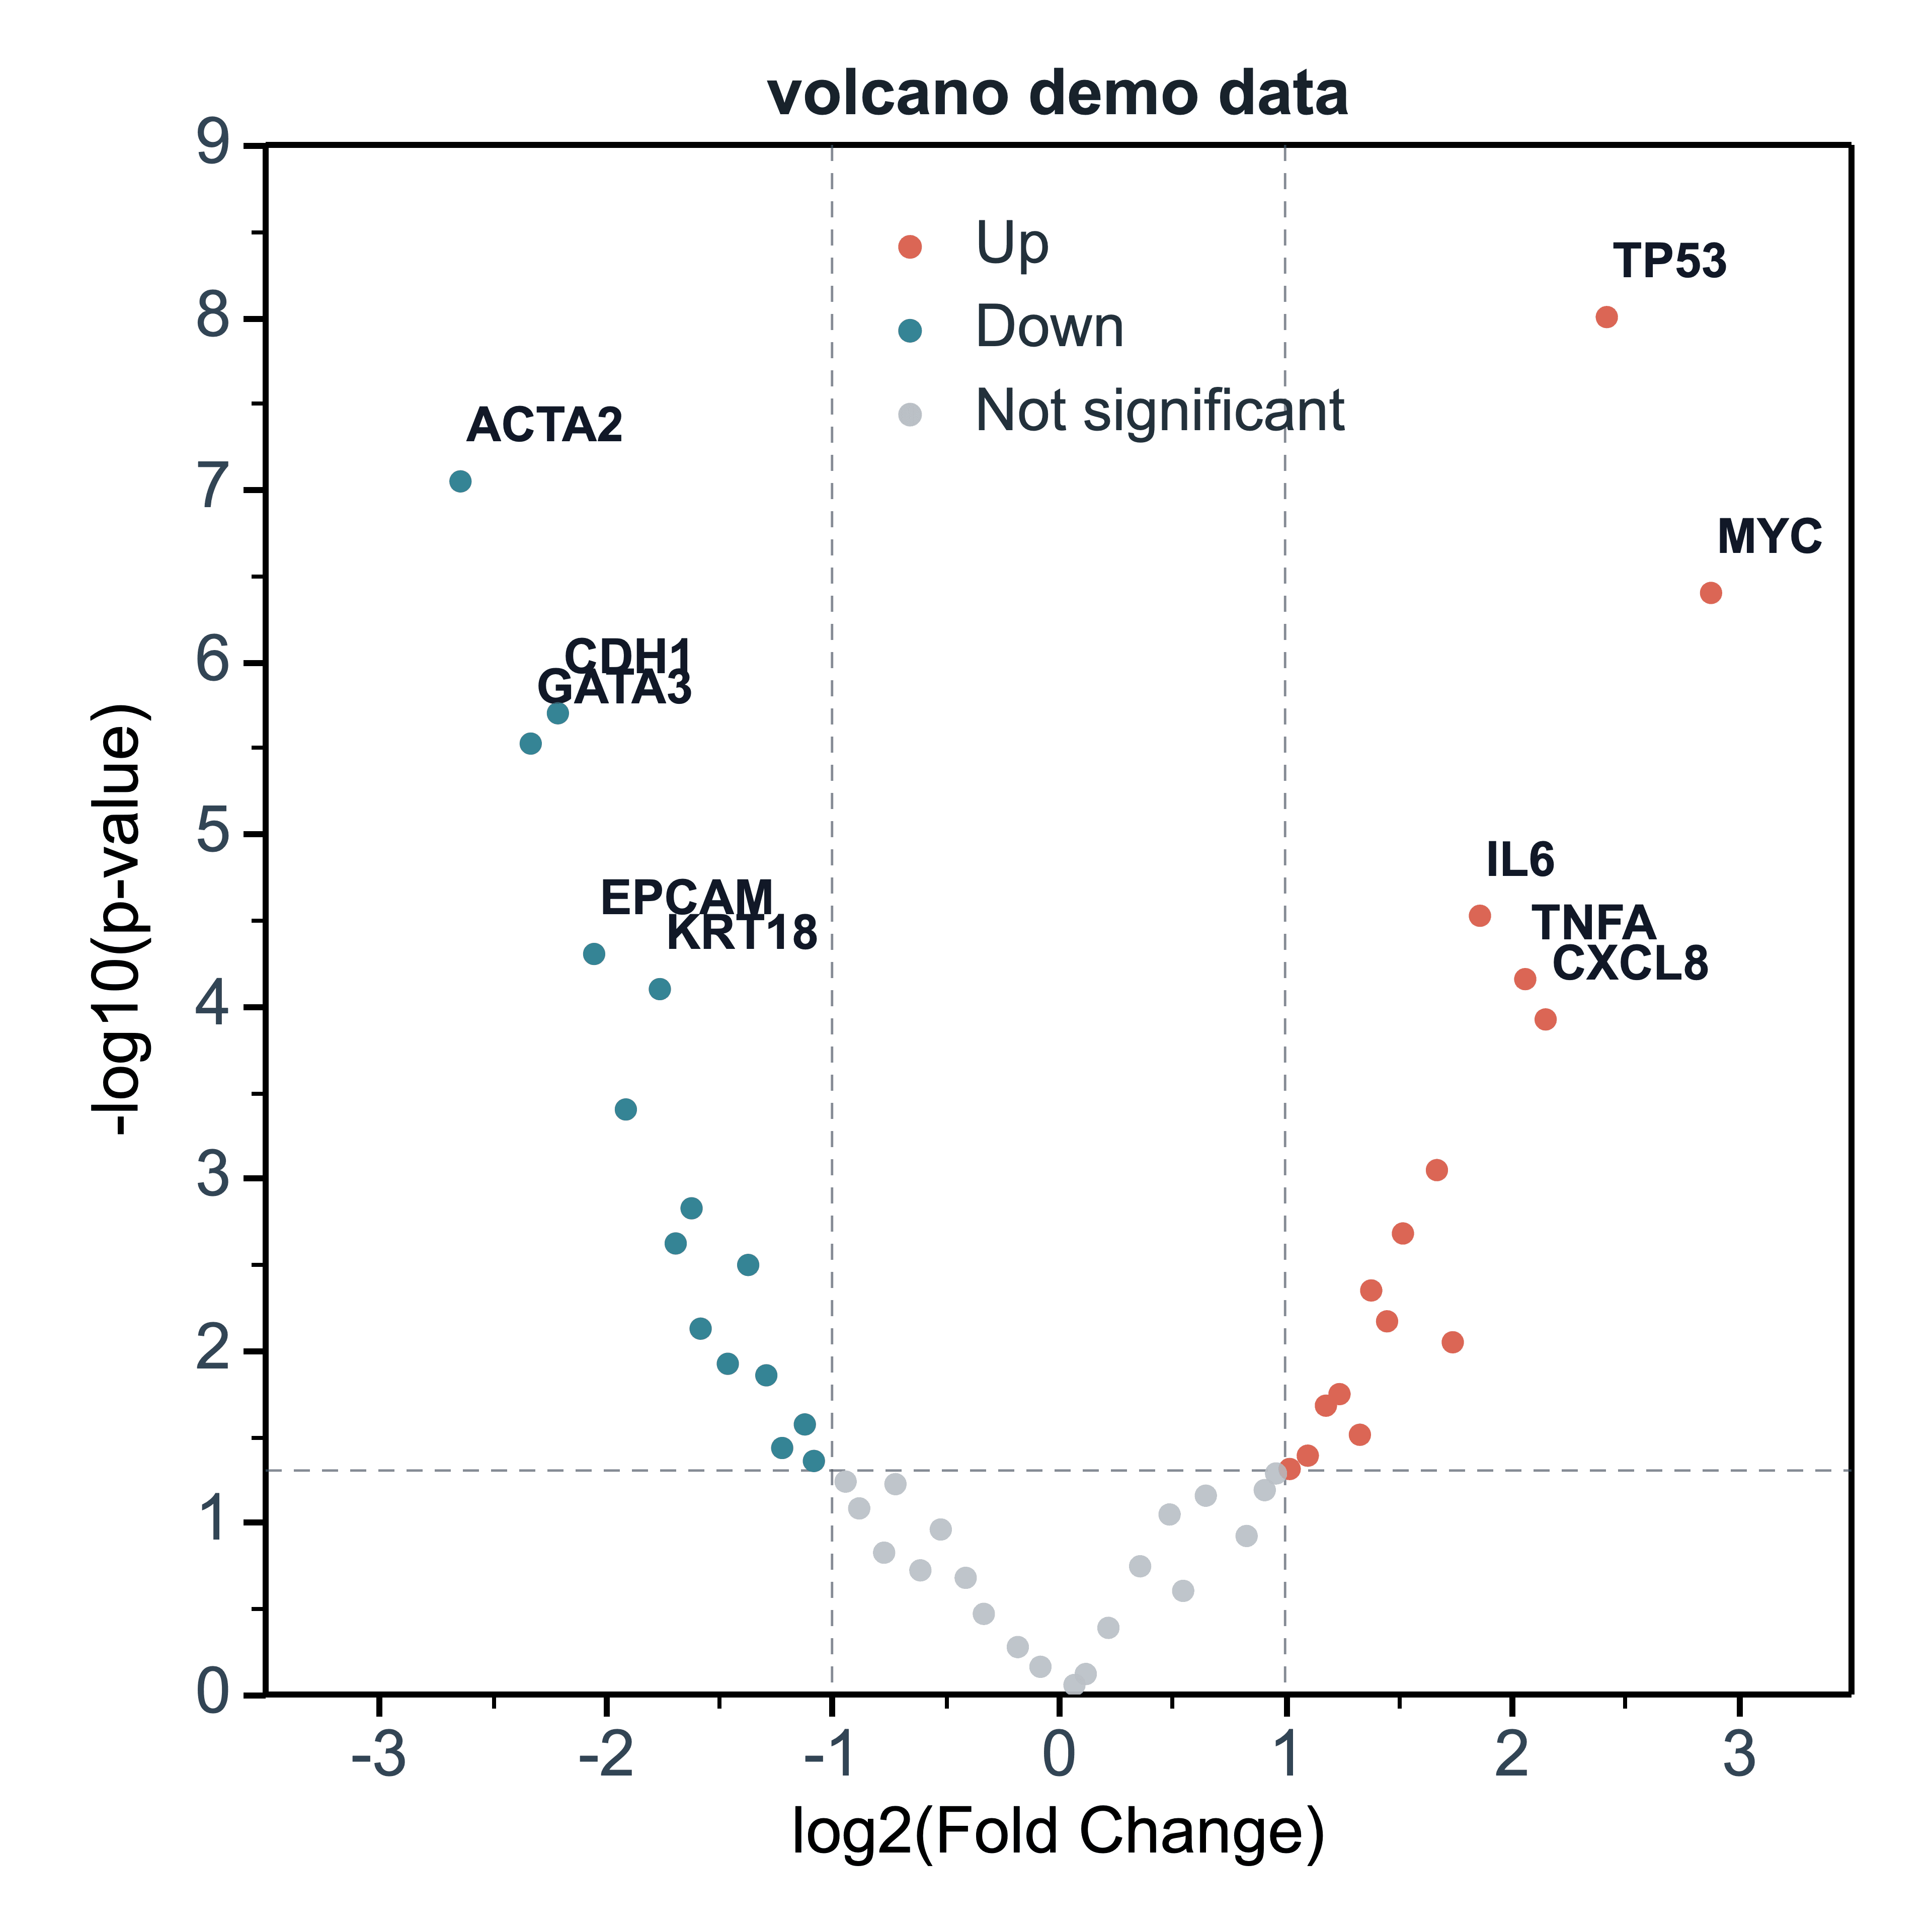
Volcano Plot
Find observations with large and significant changes
Fields & sequences
Work with 2D intensity fields, directional data, and dense multi-curve sequences.
XYZ values or a numeric matrix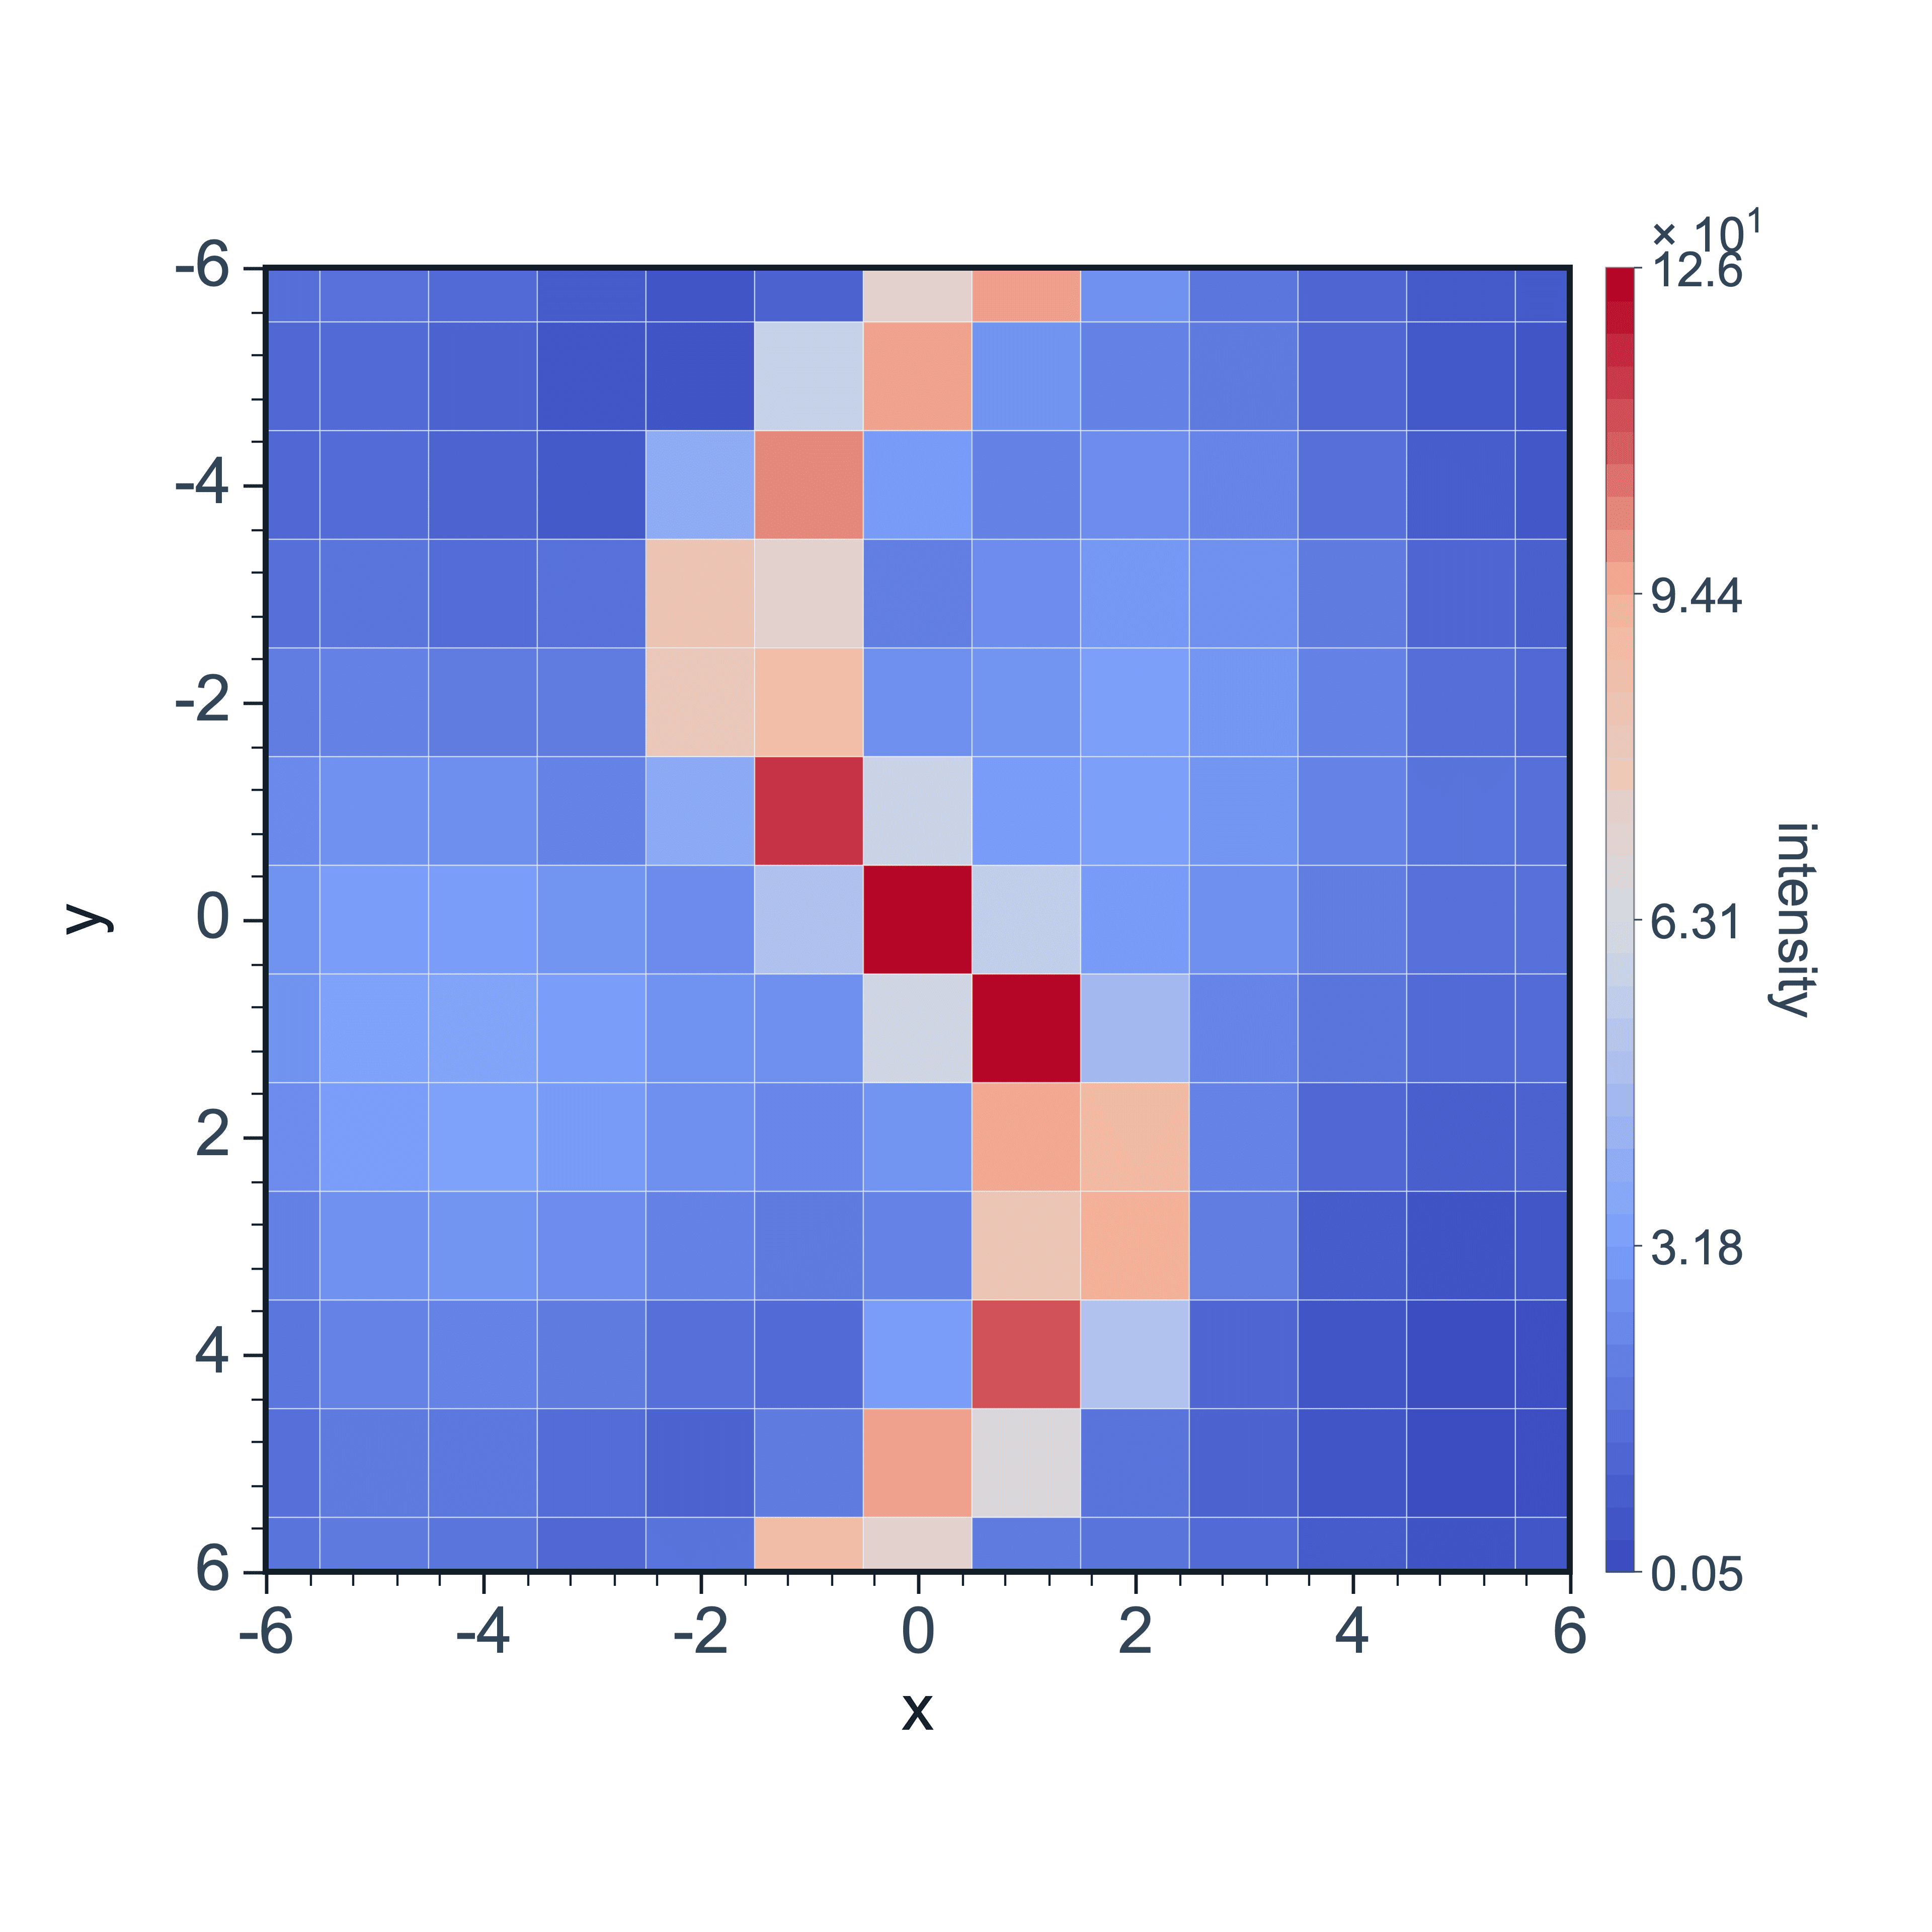
2D Color Map
Map a third intensity variable across 2D coordinates
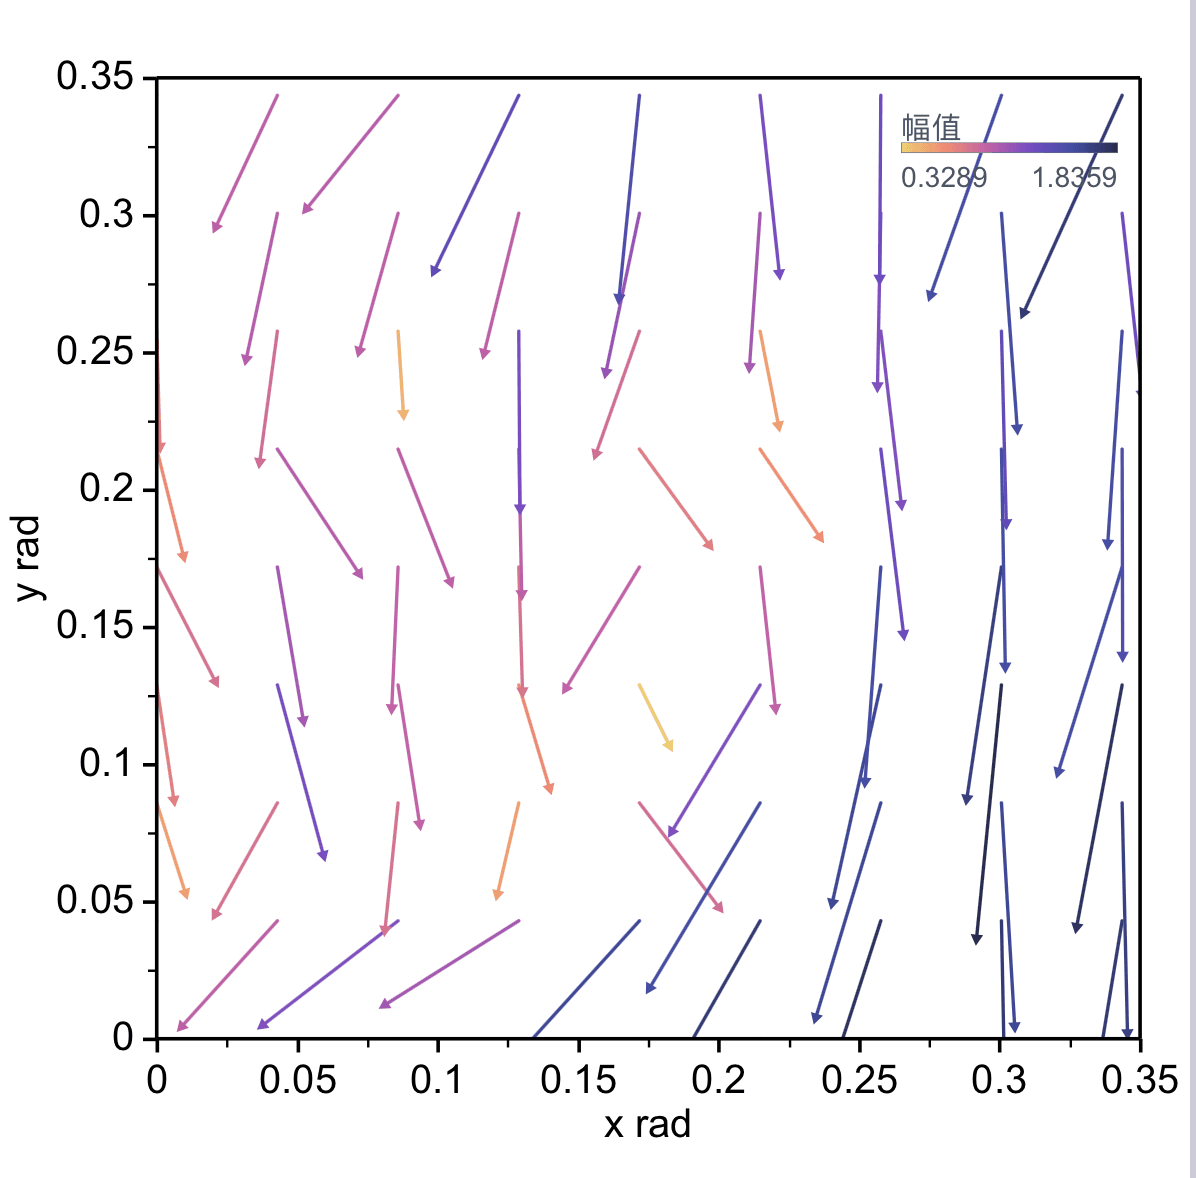
Quiver Plot
Show direction and magnitude at 2D positions
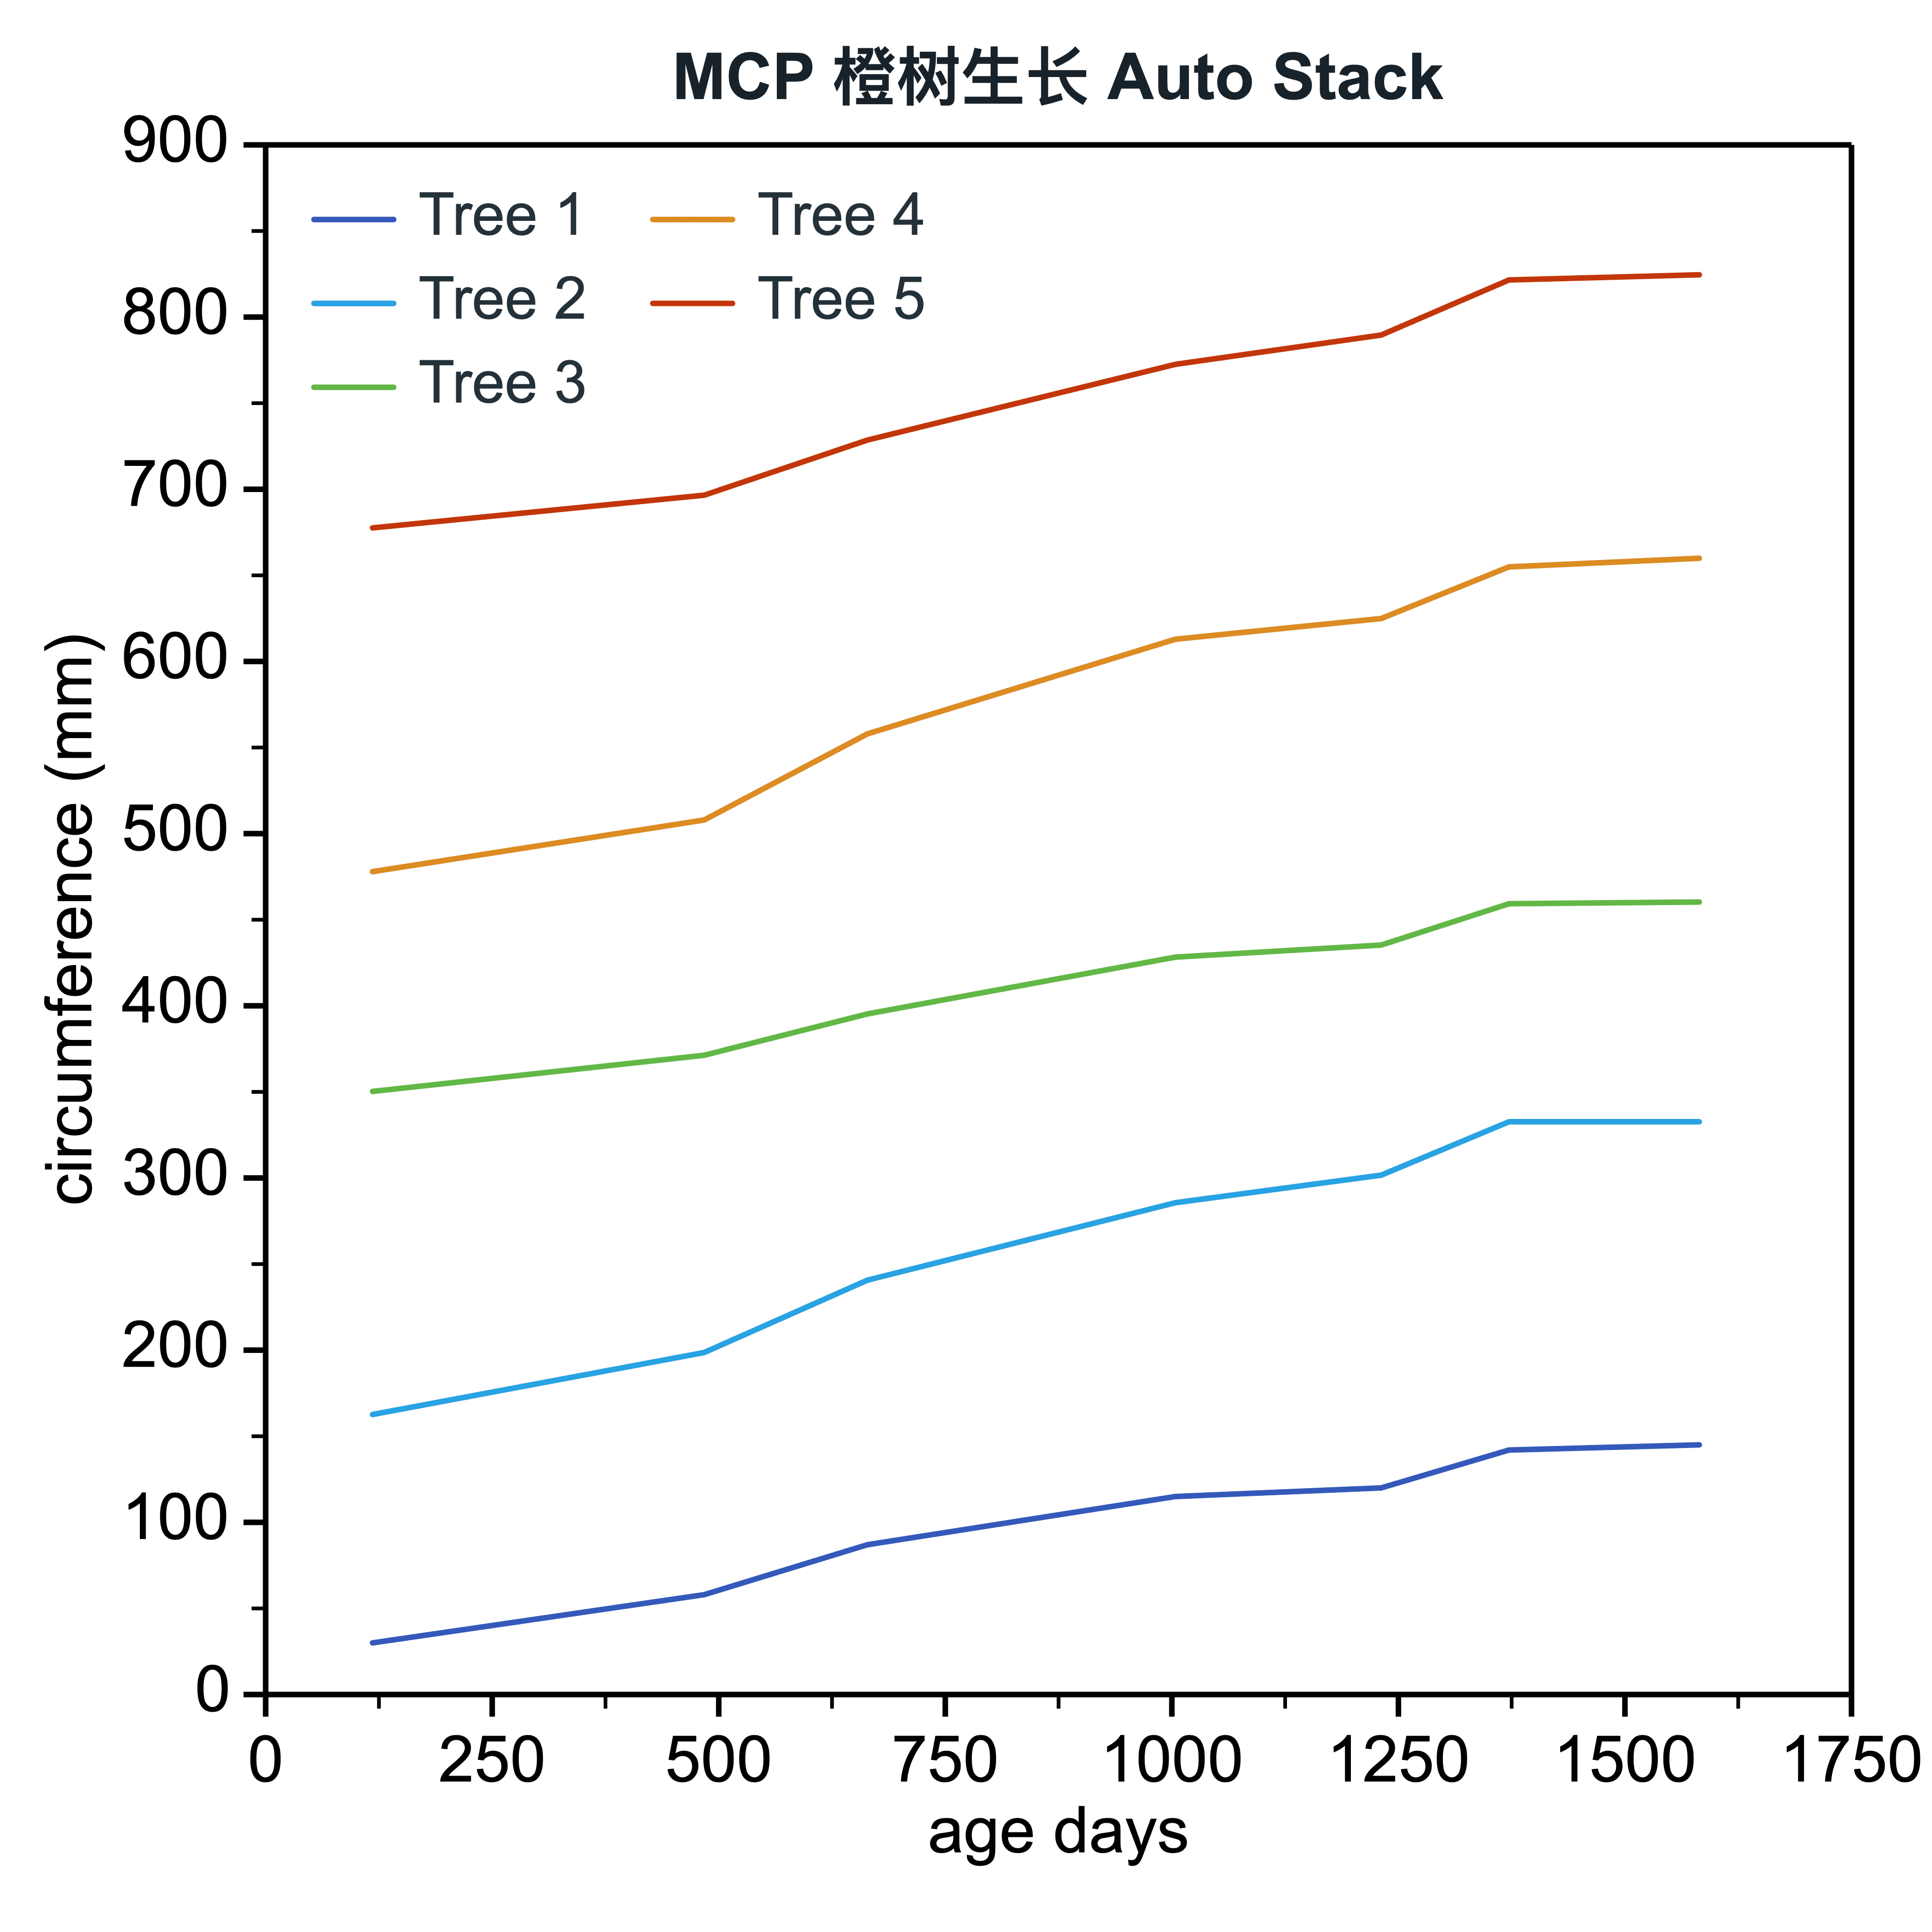
Auto Stack Lines
Offset dense curves automatically for trace-by-trace reading